
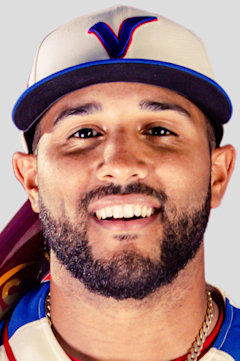
Wendell Rijo
2B · Last on a Brewers farm club: Biloxi Shuckers, 2018
- B/T
- R/R
- Size
- 5' 9", 170 lb
- Born
- 1995-09-04 · La Romana, Dominican Republic
- Acquired
- —
The path and tables below cover his minor-league seasons with any club, as the MLB Stats API lists them, through 2026. His major-league seasons are in the "Major leagues" section.
Level path
- ROK2013GCL Red Sox
- SS-A2013Lowell Spinners
- A2014Greenville Drive
- A+2015Salem Red Sox
- A+2016Salem Red Sox
- A+2016Brevard County Manatees
- A+2016
- AA2016Portland Sea Dogs
- A+2017Carolina Mudcats
- AA2017Biloxi Shuckers
- A+2018Tampa Tarpons
- AA2018Biloxi Shuckers
- AA2018Trenton Thunder
- AA2018
- A+2019Tampa Tarpons
- AA2019Trenton Thunder
- AAA2019Scranton/Wilkes-Barre RailRiders
- AA2021Mississippi Braves
- ROK2022FCL Phillies
- A2022Clearwater Threshers
- AA2022Reading Fightin Phils
- AA2023Reading Fightin Phils
Hitting
| Year | Lvl | Club | Age | Games played. | Plate appearances: every trip to the plate, walks and hit-by-pitches included. | Hits. | Doubles. | Triples. | Home runs. | Runs scored. | Runs batted in. | Walks. | Strikeouts. | Stolen bases. | Batting average: hits divided by at-bats. | On-base percentage: how often he reaches base by a hit, walk or hit-by-pitch. | Slugging percentage: total bases divided by at-bats. | On-base plus slugging: OBP and SLG added together. | Isolated power: SLG minus AVG. It counts only the extra bases. | Strikeout rate: strikeouts divided by plate appearances. | Walk rate: walks divided by plate appearances. | Batting average on balls in play: hits other than home runs, divided by at-bats that ended with the ball in play. |
|---|---|---|---|---|---|---|---|---|---|---|---|---|---|---|---|---|---|---|---|---|---|---|
| 2013 | ROK | GCL Red Sox | 17 | 49 | 203 | 46 | 15 | 0 | 0 | 28 | 20 | 22 | 29 | 15 | .271 | .368 | .359 | .727 | .088 | 14.3% | 10.8% | .319 |
| 2013 | SS-A | Lowell Spinners | 17 | 3 | 14 | 5 | 1 | 1 | 0 | 1 | 1 | 0 | 3 | 0 | .357 | .357 | .571 | .928 | .214 | 21.4% | 0.0% | .455 |
| 2014 | A | Greenville Drive | 18 | 111 | 473 | 104 | 27 | 6 | 9 | 56 | 46 | 56 | 103 | 16 | .254 | .348 | .416 | .764 | .162 | 21.8% | 11.8% | .318 |
| 2015 | A+ | Salem Red Sox | 19 | 108 | 455 | 105 | 27 | 2 | 6 | 47 | 47 | 34 | 94 | 15 | .260 | .324 | .381 | .705 | .121 | 20.7% | 7.5% | .321 |
| 2016 | A+ | Salem Red Sox | 20 | 11 | 46 | 10 | 2 | 0 | 0 | 9 | 3 | 6 | 11 | 2 | .270 | .364 | .324 | .688 | .054 | 23.9% | 13.0% | .370 |
| 2016 | A+ | Brevard County Manatees | 20 | 50 | 201 | 37 | 7 | 0 | 1 | 17 | 15 | 13 | 44 | 6 | .202 | .259 | .257 | .516 | .055 | 21.9% | 6.5% | .261 |
| 2016 | A+ | — | 20 | 61 | 247 | 47 | 9 | 0 | 1 | 26 | 18 | 19 | 55 | 8 | .214 | .278 | .268 | .546 | .054 | 22.3% | 7.7% | .279 |
| 2016 | AA | Portland Sea Dogs | 20 | 51 | 194 | 33 | 11 | 0 | 1 | 18 | 12 | 13 | 46 | 2 | .186 | .245 | .266 | .511 | .080 | 23.7% | 6.7% | .244 |
| 2017 | A+ | Carolina Mudcats | 21 | 36 | 137 | 29 | 7 | 0 | 3 | 12 | 17 | 13 | 20 | 4 | .254 | .363 | .395 | .758 | .141 | 14.6% | 9.5% | .283 |
| 2017 | AA | Biloxi Shuckers | 21 | 41 | 91 | 15 | 3 | 0 | 0 | 16 | 5 | 7 | 22 | 2 | .185 | .275 | .222 | .497 | .037 | 24.2% | 7.7% | .254 |
| 2018 | A+ | Tampa Tarpons | 22 | 3 | 12 | 1 | 1 | 0 | 0 | 1 | 1 | 1 | 3 | 0 | .125 | .333 | .250 | .583 | .125 | 25.0% | 8.3% | .167 |
| 2018 | AA | Biloxi Shuckers | 22 | 32 | 93 | 16 | 2 | 0 | 4 | 14 | 14 | 12 | 20 | 1 | .200 | .304 | .375 | .679 | .175 | 21.5% | 12.9% | .214 |
| 2018 | AA | Trenton Thunder | 22 | 49 | 197 | 38 | 10 | 1 | 0 | 19 | 12 | 20 | 29 | 2 | .217 | .297 | .286 | .583 | .069 | 14.7% | 10.2% | .260 |
| 2018 | AA | — | 22 | 81 | 290 | 54 | 12 | 1 | 4 | 33 | 26 | 32 | 49 | 3 | .212 | .300 | .314 | .614 | .102 | 16.9% | 11.0% | .248 |
| 2019 | A+ | Tampa Tarpons | 23 | 9 | 30 | 9 | 3 | 0 | 0 | 1 | 4 | 4 | 8 | 0 | .360 | .433 | .480 | .913 | .120 | 26.7% | 13.3% | .500 |
| 2019 | AA | Trenton Thunder | 23 | 51 | 208 | 44 | 11 | 0 | 6 | 35 | 23 | 19 | 46 | 3 | .235 | .309 | .390 | .699 | .155 | 22.1% | 9.1% | .281 |
| 2019 | AAA | Scranton/Wilkes-Barre RailRiders | 23 | 43 | 148 | 37 | 10 | 0 | 7 | 18 | 17 | 8 | 35 | 1 | .270 | .324 | .496 | .820 | .226 | 23.6% | 5.4% | .316 |
| 2021 | AA | Mississippi Braves | 25 | 92 | 365 | 76 | 16 | 0 | 15 | 49 | 37 | 34 | 83 | 8 | .236 | .320 | .425 | .745 | .189 | 22.7% | 9.3% | .271 |
| 2022 | ROK | FCL Phillies | 26 | 1 | 4 | 1 | 0 | 0 | 0 | 1 | 0 | 2 | 0 | 1 | .500 | .750 | .500 | 1.250 | .000 | 0.0% | 50.0% | .500 |
| 2022 | A | Clearwater Threshers | 26 | 4 | 14 | 2 | 1 | 0 | 0 | 0 | 0 | 1 | 1 | 1 | .154 | .214 | .231 | .445 | .077 | 7.1% | 7.1% | .167 |
| 2022 | AA | Reading Fightin Phils | 26 | 94 | 395 | 91 | 23 | 1 | 12 | 57 | 53 | 41 | 85 | 24 | .266 | .353 | .444 | .797 | .178 | 21.5% | 10.4% | .317 |
| 2023 | AA | Reading Fightin Phils | 27 | 21 | 86 | 14 | 3 | 0 | 0 | 6 | 8 | 9 | 27 | 0 | .187 | .291 | .227 | .518 | .040 | 31.4% | 10.5% | .292 |
OPS by game
No 2026 game log on record, so there is no chart.
Major leagues
No major-league games on record.
Posts about him
None yet.
Stats from the MLB Stats API, through Oct 9, 2026.