
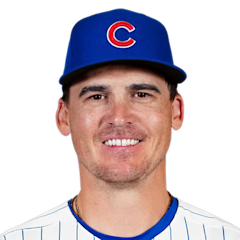
Tyler Austin
1B · Last on a Brewers farm club: San Antonio Missions, 2019
- B/T
- R/R
- Size
- 6' 2", 220 lb
- Born
- 1991-09-06 · Conyers, GA, USA
- Acquired
- Drafted 2010, round 13, pick 415, by New York Yankees
- MLB debut
- 2016-08-13
The path and tables below cover his minor-league seasons with any club, as the MLB Stats API lists them, through 2026. His major-league seasons are in the "Major leagues" section.
Level path
- ROK2010GCL Yankees
- ROK2011GCL Yankees
- SS-A2011Staten Island Yankees
- ROK2012GCL Yankees
- A2012Charleston RiverDogs
- A+2012Tampa Yankees
- AA2012Trenton Thunder
- ROK2013GCL Yankees2
- AA2013Trenton Thunder
- AA2014Trenton Thunder
- AA2015Trenton Thunder
- AAA2015Scranton/Wilkes-Barre RailRiders
- AA2016Trenton Thunder
- AAA2016Scranton/Wilkes-Barre RailRiders
- AA2017Trenton Thunder
- AAA2017Scranton/Wilkes-Barre RailRiders
- AAA2018Scranton/Wilkes-Barre RailRiders
- AAA2018Rochester Red Wings
- AAA2018
- AAA2019San Antonio Missions
Hitting
| Year | Lvl | Club | Age | Games played. | Plate appearances: every trip to the plate, walks and hit-by-pitches included. | Hits. | Doubles. | Triples. | Home runs. | Runs scored. | Runs batted in. | Walks. | Strikeouts. | Stolen bases. | Batting average: hits divided by at-bats. | On-base percentage: how often he reaches base by a hit, walk or hit-by-pitch. | Slugging percentage: total bases divided by at-bats. | On-base plus slugging: OBP and SLG added together. | Isolated power: SLG minus AVG. It counts only the extra bases. | Strikeout rate: strikeouts divided by plate appearances. | Walk rate: walks divided by plate appearances. | Batting average on balls in play: hits other than home runs, divided by at-bats that ended with the ball in play. |
|---|---|---|---|---|---|---|---|---|---|---|---|---|---|---|---|---|---|---|---|---|---|---|
| 2010 | ROK | GCL Yankees | 18 | 2 | 4 | 0 | 0 | 0 | 0 | 0 | 0 | 0 | 1 | 0 | .000 | .500 | .000 | .500 | .000 | 25.0% | 0.0% | .000 |
| 2011 | ROK | GCL Yankees | 19 | 20 | 89 | 32 | 8 | 1 | 3 | 13 | 22 | 5 | 16 | 11 | .390 | .438 | .622 | 1.060 | .232 | 18.0% | 5.6% | .460 |
| 2011 | SS-A | Staten Island Yankees | 19 | 27 | 112 | 31 | 10 | 1 | 3 | 16 | 14 | 10 | 23 | 7 | .323 | .402 | .542 | .944 | .219 | 20.5% | 8.9% | .389 |
| 2012 | ROK | GCL Yankees | 20 | 2 | 7 | 3 | 0 | 0 | 1 | 1 | 2 | 1 | 1 | 0 | .500 | .571 | 1.000 | 1.571 | .500 | 14.3% | 14.3% | .500 |
| 2012 | A | Charleston RiverDogs | 20 | 70 | 309 | 85 | 22 | 5 | 14 | 69 | 54 | 37 | 68 | 17 | .320 | .405 | .598 | 1.003 | .278 | 22.0% | 12.0% | .380 |
| 2012 | A+ | Tampa Yankees | 20 | 36 | 148 | 43 | 13 | 1 | 2 | 20 | 23 | 12 | 28 | 6 | .321 | .385 | .478 | .863 | .157 | 18.9% | 8.1% | .394 |
| 2012 | AA | Trenton Thunder | 20 | 2 | 8 | 2 | 0 | 0 | 0 | 2 | 1 | 1 | 1 | 0 | .286 | .375 | .286 | .661 | .000 | 12.5% | 12.5% | .333 |
| 2013 | ROK | GCL Yankees2 | 21 | 2 | 7 | 4 | 0 | 0 | 0 | 1 | 0 | 1 | 0 | 0 | .667 | .714 | .667 | 1.381 | .000 | 0.0% | 14.3% | .667 |
| 2013 | AA | Trenton Thunder | 21 | 83 | 366 | 82 | 17 | 1 | 6 | 43 | 40 | 41 | 79 | 4 | .257 | .344 | .373 | .717 | .116 | 21.6% | 11.2% | .321 |
| 2014 | AA | Trenton Thunder | 22 | 105 | 437 | 109 | 20 | 5 | 9 | 56 | 47 | 36 | 80 | 3 | .275 | .336 | .419 | .755 | .144 | 18.3% | 8.2% | .323 |
| 2015 | AA | Trenton Thunder | 23 | 21 | 86 | 20 | 5 | 2 | 2 | 8 | 8 | 8 | 16 | 3 | .260 | .337 | .455 | .792 | .195 | 18.6% | 9.3% | .305 |
| 2015 | AAA | Scranton/Wilkes-Barre RailRiders | 23 | 73 | 299 | 62 | 8 | 0 | 4 | 33 | 27 | 26 | 81 | 8 | .235 | .309 | .311 | .620 | .076 | 27.1% | 8.7% | .317 |
| 2016 | AA | Trenton Thunder | 24 | 50 | 210 | 46 | 10 | 1 | 4 | 22 | 29 | 30 | 46 | 1 | .260 | .367 | .395 | .762 | .135 | 21.9% | 14.3% | .326 |
| 2016 | AAA | Scranton/Wilkes-Barre RailRiders | 24 | 57 | 234 | 65 | 24 | 0 | 13 | 39 | 49 | 32 | 59 | 5 | .323 | .415 | .637 | 1.052 | .314 | 25.2% | 13.7% | .400 |
| 2017 | AA | Trenton Thunder | 25 | 5 | 17 | 6 | 1 | 2 | 0 | 5 | 1 | 2 | 2 | 0 | .429 | .529 | .786 | 1.315 | .357 | 11.8% | 11.8% | .500 |
| 2017 | AAA | Scranton/Wilkes-Barre RailRiders | 25 | 47 | 190 | 47 | 14 | 1 | 10 | 29 | 32 | 18 | 52 | 0 | .275 | .342 | .544 | .886 | .269 | 27.4% | 9.5% | .336 |
| 2018 | AAA | Scranton/Wilkes-Barre RailRiders | 26 | 26 | 108 | 25 | 9 | 0 | 6 | 14 | 14 | 8 | 32 | 0 | .253 | .315 | .525 | .840 | .272 | 29.6% | 7.4% | .311 |
| 2018 | AAA | Rochester Red Wings | 26 | 9 | 40 | 10 | 2 | 1 | 3 | 6 | 8 | 1 | 10 | 0 | .263 | .300 | .605 | .905 | .342 | 25.0% | 2.5% | .280 |
| 2018 | AAA | — | 26 | 35 | 148 | 35 | 11 | 1 | 9 | 20 | 22 | 9 | 42 | 0 | .255 | .311 | .547 | .858 | .292 | 28.4% | 6.1% | .302 |
| 2019 | AAA | San Antonio Missions | 27 | 15 | 63 | 18 | 3 | 0 | 4 | 15 | 10 | 8 | 17 | 3 | .333 | .413 | .611 | 1.024 | .278 | 27.0% | 12.7% | .412 |
OPS by game
No 2026 game log on record, so there is no chart.
Major leagues
Hitting
| Year | Club | Age | Games played. | Plate appearances: every trip to the plate, walks and hit-by-pitches included. | Hits. | Doubles. | Triples. | Home runs. | Runs scored. | Runs batted in. | Walks. | Strikeouts. | Stolen bases. | Batting average: hits divided by at-bats. | On-base percentage: how often he reaches base by a hit, walk or hit-by-pitch. | Slugging percentage: total bases divided by at-bats. | On-base plus slugging: OBP and SLG added together. | Isolated power: SLG minus AVG. It counts only the extra bases. | Strikeout rate: strikeouts divided by plate appearances. | Walk rate: walks divided by plate appearances. | Batting average on balls in play: hits other than home runs, divided by at-bats that ended with the ball in play. |
|---|---|---|---|---|---|---|---|---|---|---|---|---|---|---|---|---|---|---|---|---|---|
| 2016 | New York Yankees | 24 | 31 | 90 | 20 | 3 | 0 | 5 | 7 | 12 | 7 | 36 | 1 | .241 | .300 | .458 | .758 | .217 | 40.0% | 7.8% | .357 |
| 2017 | New York Yankees | 25 | 20 | 46 | 9 | 2 | 0 | 2 | 4 | 8 | 4 | 17 | 0 | .225 | .283 | .425 | .708 | .200 | 37.0% | 8.7% | .304 |
| 2018 | New York Yankees | 26 | 34 | 132 | 27 | 6 | 0 | 8 | 16 | 23 | 8 | 53 | 1 | .223 | .280 | .471 | .751 | .248 | 40.2% | 6.1% | .311 |
| 2018 | Minnesota Twins | 26 | 35 | 136 | 29 | 4 | 0 | 9 | 18 | 24 | 11 | 42 | 0 | .236 | .294 | .488 | .782 | .252 | 30.9% | 8.1% | .270 |
| 2018 | 2 teams | 26 | 69 | 268 | 56 | 10 | 0 | 17 | 34 | 47 | 19 | 95 | 1 | .230 | .287 | .480 | .767 | .250 | 35.4% | 7.1% | .289 |
| 2019 | Minnesota Twins | 27 | 2 | 5 | 1 | 1 | 0 | 0 | 1 | 0 | 1 | 3 | 0 | .250 | .400 | .500 | .900 | .250 | 60.0% | 20.0% | 1.000 |
| 2019 | San Francisco Giants | 27 | 70 | 147 | 24 | 2 | 1 | 8 | 24 | 20 | 17 | 57 | 1 | .185 | .279 | .400 | .679 | .215 | 38.8% | 11.6% | .246 |
| 2019 | Milwaukee Brewers | 27 | 17 | 27 | 4 | 2 | 0 | 1 | 5 | 4 | 6 | 7 | 1 | .200 | .370 | .450 | .820 | .250 | 25.9% | 22.2% | .231 |
| 2019 | 3 teams | 27 | 89 | 179 | 29 | 5 | 1 | 9 | 30 | 24 | 24 | 67 | 2 | .188 | .296 | .409 | .705 | .221 | 37.4% | 13.4% | .253 |
Posts about him
None yet.
Stats from the MLB Stats API, through Oct 9, 2026.