
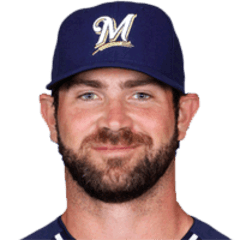
Sean Halton
1B · Last on a Brewers farm club: Nashville Sounds, 2014
- B/T
- R/R
- Size
- 6' 4", 260 lb
- Born
- 1987-06-07 · San Francisco, CA, USA
- Acquired
- Drafted 2009, round 13, pick 406, by Milwaukee Brewers
- MLB debut
- 2013-06-27
The path and tables below cover his minor-league seasons with any club, as the MLB Stats API lists them, through 2026. His major-league seasons are in the "Major leagues" section.
Level path
- ROK2009AZL Brewers
- ROK2009Helena Brewers
- ROK2009
- A2010Wisconsin Timber Rattlers
- A+2010Brevard County Manatees
- AA2011Huntsville Stars
- AAA2012Nashville Sounds
- AAA2013Nashville Sounds
- AAA2014Nashville Sounds
- AA2015Bowie Baysox
- AAA2015Norfolk Tides
- AAA2016Broncos de Reynosa
Hitting
| Year | Lvl | Club | Age | Games played. | Plate appearances: every trip to the plate, walks and hit-by-pitches included. | Hits. | Doubles. | Triples. | Home runs. | Runs scored. | Runs batted in. | Walks. | Strikeouts. | Stolen bases. | Batting average: hits divided by at-bats. | On-base percentage: how often he reaches base by a hit, walk or hit-by-pitch. | Slugging percentage: total bases divided by at-bats. | On-base plus slugging: OBP and SLG added together. | Isolated power: SLG minus AVG. It counts only the extra bases. | Strikeout rate: strikeouts divided by plate appearances. | Walk rate: walks divided by plate appearances. | Batting average on balls in play: hits other than home runs, divided by at-bats that ended with the ball in play. |
|---|---|---|---|---|---|---|---|---|---|---|---|---|---|---|---|---|---|---|---|---|---|---|
| 2009 | ROK | AZL Brewers | 22 | 25 | 106 | 31 | 7 | 1 | 3 | 13 | 17 | 8 | 18 | 3 | .330 | .396 | .521 | .917 | .191 | 17.0% | 7.5% | .378 |
| 2009 | ROK | Helena Brewers | 22 | 44 | 176 | 57 | 14 | 0 | 3 | 27 | 28 | 9 | 38 | 4 | .354 | .398 | .497 | .895 | .143 | 21.6% | 5.1% | .443 |
| 2009 | ROK | — | 22 | 69 | 282 | 88 | 21 | 1 | 6 | 40 | 45 | 17 | 56 | 7 | .345 | .397 | .506 | .903 | .161 | 19.9% | 6.0% | .418 |
| 2010 | A | Wisconsin Timber Rattlers | 23 | 23 | 93 | 19 | 4 | 0 | 0 | 11 | 11 | 5 | 14 | 0 | .221 | .269 | .267 | .536 | .046 | 15.1% | 5.4% | .260 |
| 2010 | A+ | Brevard County Manatees | 23 | 104 | 445 | 116 | 17 | 1 | 10 | 42 | 77 | 28 | 88 | 2 | .292 | .345 | .416 | .761 | .124 | 19.8% | 6.3% | .344 |
| 2011 | AA | Huntsville Stars | 24 | 116 | 482 | 131 | 39 | 1 | 7 | 49 | 65 | 32 | 83 | 6 | .298 | .346 | .440 | .786 | .142 | 17.2% | 6.6% | .348 |
| 2012 | AAA | Nashville Sounds | 25 | 119 | 412 | 98 | 23 | 3 | 17 | 48 | 57 | 43 | 81 | 0 | .274 | .354 | .497 | .851 | .223 | 19.7% | 10.4% | .305 |
| 2013 | AAA | Nashville Sounds | 26 | 96 | 399 | 96 | 29 | 2 | 11 | 51 | 51 | 35 | 92 | 6 | .273 | .348 | .460 | .808 | .187 | 23.1% | 8.8% | .336 |
| 2014 | AAA | Nashville Sounds | 27 | 122 | 453 | 122 | 29 | 3 | 8 | 63 | 63 | 30 | 90 | 0 | .293 | .342 | .435 | .777 | .142 | 19.9% | 6.6% | .354 |
| 2015 | AA | Bowie Baysox | 28 | 45 | 193 | 40 | 10 | 0 | 4 | 15 | 22 | 15 | 25 | 1 | .240 | .316 | .371 | .687 | .131 | 13.0% | 7.8% | .252 |
| 2015 | AAA | Norfolk Tides | 28 | 73 | 293 | 57 | 11 | 0 | 3 | 25 | 30 | 28 | 72 | 3 | .221 | .304 | .298 | .602 | .077 | 24.6% | 9.6% | .290 |
| 2016 | AAA | Broncos de Reynosa | 29 | 30 | 124 | 29 | 4 | 2 | 2 | 15 | 17 | 15 | 26 | 0 | .271 | .363 | .402 | .765 | .131 | 21.0% | 12.1% | .338 |
OPS by game
No 2026 game log on record, so there is no chart.
Major leagues
Hitting
| Year | Club | Age | Games played. | Plate appearances: every trip to the plate, walks and hit-by-pitches included. | Hits. | Doubles. | Triples. | Home runs. | Runs scored. | Runs batted in. | Walks. | Strikeouts. | Stolen bases. | Batting average: hits divided by at-bats. | On-base percentage: how often he reaches base by a hit, walk or hit-by-pitch. | Slugging percentage: total bases divided by at-bats. | On-base plus slugging: OBP and SLG added together. | Isolated power: SLG minus AVG. It counts only the extra bases. | Strikeout rate: strikeouts divided by plate appearances. | Walk rate: walks divided by plate appearances. | Batting average on balls in play: hits other than home runs, divided by at-bats that ended with the ball in play. |
|---|---|---|---|---|---|---|---|---|---|---|---|---|---|---|---|---|---|---|---|---|---|
| 2013 | Milwaukee Brewers | 26 | 42 | 111 | 24 | 4 | 0 | 4 | 9 | 17 | 5 | 31 | 0 | .238 | .291 | .396 | .687 | .158 | 27.9% | 4.5% | .299 |
Posts about him
None yet.
Stats from the MLB Stats API, through Oct 9, 2026.