
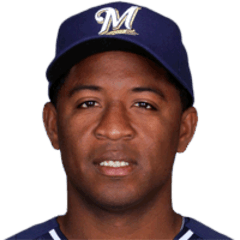
Robinzon Díaz
C · Last on a Brewers farm club: Colorado Springs Sky Sox, 2015
- B/T
- R/R
- Size
- 5' 11", 220 lb
- Born
- 1983-09-19 · Monte Plata, Dominican Republic
- Acquired
- —
- MLB debut
- 2008-04-23
The path and tables below cover his minor-league seasons with any club, as the MLB Stats API lists them, through 2026. His major-league seasons are in the "Major leagues" section.
Level path
- ROK2002Medicine Hat Blue Jays
- A+2002Dunedin Blue Jays
- ROK2003Pulaski Blue Jays
- A2004Charleston AlleyCats
- A+2005Dunedin Blue Jays
- A+2006Dunedin Blue Jays
- AA2007New Hampshire Fisher Cats
- AAA2007Syracuse Chiefs
- ROK2008GCL Blue Jays
- A+2008Dunedin Blue Jays
- AAA2008Syracuse Chiefs
- AAA2008Indianapolis Indians
- AAA2008
- AAA2009Indianapolis Indians
- AAA2010Toledo Mud Hens
- AA2011Frisco RoughRiders
- AAA2011Round Rock Express
- AAA2012Salt Lake Bees
- AAA2012Round Rock Express
- AAA2012
- AA2013Huntsville Stars
- AAA2013Nashville Sounds
- AA2014Huntsville Stars
- AAA2014Nashville Sounds
- A+2015Brevard County Manatees
- AAA2015Colorado Springs Sky Sox
- AAA2016Olmecas de Tabasco
Hitting
| Year | Lvl | Club | Age | Games played. | Plate appearances: every trip to the plate, walks and hit-by-pitches included. | Hits. | Doubles. | Triples. | Home runs. | Runs scored. | Runs batted in. | Walks. | Strikeouts. | Stolen bases. | Batting average: hits divided by at-bats. | On-base percentage: how often he reaches base by a hit, walk or hit-by-pitch. | Slugging percentage: total bases divided by at-bats. | On-base plus slugging: OBP and SLG added together. | Isolated power: SLG minus AVG. It counts only the extra bases. | Strikeout rate: strikeouts divided by plate appearances. | Walk rate: walks divided by plate appearances. | Batting average on balls in play: hits other than home runs, divided by at-bats that ended with the ball in play. |
|---|---|---|---|---|---|---|---|---|---|---|---|---|---|---|---|---|---|---|---|---|---|---|
| 2002 | ROK | Medicine Hat Blue Jays | 18 | 58 | 206 | 57 | 9 | 0 | 0 | 29 | 20 | 13 | 19 | 7 | .297 | .345 | .344 | .689 | .047 | 9.2% | 6.3% | .329 |
| 2002 | A+ | Dunedin Blue Jays | 18 | 10 | 28 | 3 | 0 | 0 | 0 | 3 | 1 | 1 | 4 | 0 | .120 | .148 | .120 | .268 | .000 | 14.3% | 3.6% | .136 |
| 2003 | ROK | Pulaski Blue Jays | 19 | 48 | 199 | 68 | 20 | 2 | 1 | 33 | 44 | 10 | 14 | 1 | .374 | .407 | .522 | .929 | .148 | 7.0% | 5.0% | .392 |
| 2004 | A | Charleston AlleyCats | 20 | 105 | 449 | 117 | 20 | 2 | 2 | 62 | 42 | 27 | 31 | 10 | .287 | .341 | .361 | .702 | .074 | 6.9% | 6.0% | .304 |
| 2005 | A+ | Dunedin Blue Jays | 21 | 100 | 414 | 115 | 17 | 6 | 1 | 47 | 65 | 16 | 28 | 5 | .298 | .333 | .381 | .714 | .083 | 6.8% | 3.9% | .316 |
| 2006 | A+ | Dunedin Blue Jays | 22 | 104 | 447 | 128 | 21 | 1 | 3 | 59 | 44 | 20 | 37 | 8 | .306 | .341 | .383 | .724 | .077 | 8.3% | 4.5% | .329 |
| 2007 | AA | New Hampshire Fisher Cats | 23 | 74 | 319 | 95 | 17 | 1 | 3 | 33 | 30 | 11 | 16 | 5 | .316 | .344 | .409 | .753 | .093 | 5.0% | 3.4% | .324 |
| 2007 | AAA | Syracuse Chiefs | 23 | 19 | 69 | 22 | 3 | 0 | 1 | 4 | 10 | 1 | 6 | 0 | .338 | .358 | .431 | .789 | .093 | 8.7% | 1.4% | .362 |
| 2008 | ROK | GCL Blue Jays | 24 | 15 | 50 | 17 | 3 | 0 | 2 | 9 | 10 | 2 | 4 | 0 | .386 | .420 | .591 | 1.011 | .205 | 8.0% | 4.0% | .375 |
| 2008 | A+ | Dunedin Blue Jays | 24 | 6 | 25 | 8 | 1 | 0 | 1 | 3 | 3 | 0 | 0 | 0 | .320 | .320 | .480 | .800 | .160 | 0.0% | 0.0% | .292 |
| 2008 | AAA | Syracuse Chiefs | 24 | 36 | 141 | 32 | 7 | 1 | 1 | 7 | 13 | 5 | 10 | 0 | .244 | .266 | .336 | .602 | .092 | 7.1% | 3.5% | .252 |
| 2008 | AAA | Indianapolis Indians | 24 | 5 | 14 | 5 | 0 | 1 | 0 | 0 | 3 | 0 | 0 | 1 | .357 | .357 | .500 | .857 | .143 | 0.0% | 0.0% | .357 |
| 2008 | AAA | — | 24 | 41 | 155 | 37 | 7 | 2 | 1 | 7 | 16 | 5 | 10 | 1 | .255 | .275 | .352 | .627 | .097 | 6.5% | 3.2% | .263 |
| 2009 | AAA | Indianapolis Indians | 25 | 44 | 163 | 39 | 4 | 0 | 3 | 18 | 15 | 9 | 12 | 0 | .262 | .308 | .349 | .657 | .087 | 7.4% | 5.5% | .269 |
| 2010 | AAA | Toledo Mud Hens | 26 | 71 | 262 | 64 | 17 | 2 | 1 | 29 | 21 | 5 | 13 | 0 | .255 | .269 | .351 | .620 | .096 | 5.0% | 1.9% | .263 |
| 2011 | AA | Frisco RoughRiders | 27 | 17 | 62 | 20 | 1 | 0 | 3 | 11 | 8 | 4 | 4 | 0 | .357 | .419 | .536 | .955 | .179 | 6.5% | 6.5% | .347 |
| 2011 | AAA | Round Rock Express | 27 | 38 | 149 | 43 | 3 | 0 | 4 | 21 | 14 | 5 | 8 | 0 | .303 | .324 | .408 | .732 | .105 | 5.4% | 3.4% | .298 |
| 2012 | AAA | Salt Lake Bees | 28 | 46 | 166 | 45 | 10 | 1 | 4 | 25 | 31 | 5 | 9 | 2 | .285 | .309 | .437 | .746 | .152 | 5.4% | 3.0% | .281 |
| 2012 | AAA | Round Rock Express | 28 | 7 | 26 | 8 | 2 | 0 | 0 | 3 | 2 | 1 | 1 | 0 | .320 | .346 | .400 | .746 | .080 | 3.8% | 3.8% | .333 |
| 2012 | AAA | — | 28 | 53 | 192 | 53 | 12 | 1 | 4 | 28 | 33 | 6 | 10 | 2 | .290 | .314 | .432 | .746 | .142 | 5.2% | 3.1% | .288 |
| 2013 | AA | Huntsville Stars | 29 | 58 | 179 | 48 | 12 | 1 | 3 | 12 | 22 | 4 | 14 | 1 | .276 | .292 | .408 | .700 | .132 | 7.8% | 2.2% | .287 |
| 2013 | AAA | Nashville Sounds | 29 | 50 | 193 | 58 | 9 | 1 | 4 | 27 | 20 | 14 | 16 | 0 | .328 | .375 | .458 | .833 | .130 | 8.3% | 7.3% | .342 |
| 2014 | AA | Huntsville Stars | 30 | 45 | 160 | 44 | 7 | 0 | 0 | 12 | 10 | 7 | 15 | 1 | .293 | .319 | .340 | .659 | .047 | 9.4% | 4.4% | .319 |
| 2014 | AAA | Nashville Sounds | 30 | 38 | 148 | 33 | 6 | 0 | 3 | 14 | 13 | 4 | 15 | 0 | .232 | .253 | .338 | .591 | .106 | 10.1% | 2.7% | .242 |
| 2015 | A+ | Brevard County Manatees | 31 | 11 | 45 | 9 | 1 | 0 | 0 | 1 | 4 | 1 | 5 | 0 | .205 | .222 | .227 | .449 | .022 | 11.1% | 2.2% | .231 |
| 2015 | AAA | Colorado Springs Sky Sox | 31 | 44 | 127 | 39 | 4 | 0 | 0 | 9 | 11 | 6 | 7 | 0 | .322 | .354 | .355 | .709 | .033 | 5.5% | 4.7% | .342 |
| 2016 | AAA | Olmecas de Tabasco | 32 | 34 | 142 | 37 | 6 | 1 | 2 | 17 | 16 | 6 | 12 | 4 | .278 | .324 | .383 | .707 | .105 | 8.5% | 4.2% | .294 |
OPS by game
No 2026 game log on record, so there is no chart.
Major leagues
Hitting
| Year | Club | Age | Games played. | Plate appearances: every trip to the plate, walks and hit-by-pitches included. | Hits. | Doubles. | Triples. | Home runs. | Runs scored. | Runs batted in. | Walks. | Strikeouts. | Stolen bases. | Batting average: hits divided by at-bats. | On-base percentage: how often he reaches base by a hit, walk or hit-by-pitch. | Slugging percentage: total bases divided by at-bats. | On-base plus slugging: OBP and SLG added together. | Isolated power: SLG minus AVG. It counts only the extra bases. | Strikeout rate: strikeouts divided by plate appearances. | Walk rate: walks divided by plate appearances. | Batting average on balls in play: hits other than home runs, divided by at-bats that ended with the ball in play. |
|---|---|---|---|---|---|---|---|---|---|---|---|---|---|---|---|---|---|---|---|---|---|
| 2008 | Toronto Blue Jays | 24 | 1 | 4 | 0 | 0 | 0 | 0 | 0 | 0 | 0 | 1 | 0 | .000 | .000 | .000 | .000 | .000 | 25.0% | 0.0% | .000 |
| 2008 | Pittsburgh Pirates | 24 | 2 | 6 | 3 | 0 | 0 | 0 | 0 | 1 | 0 | 1 | 1 | .500 | .500 | .500 | 1.000 | .000 | 16.7% | 0.0% | .600 |
| 2008 | 2 teams | 24 | 3 | 10 | 3 | 0 | 0 | 0 | 0 | 1 | 0 | 2 | 1 | .300 | .300 | .300 | .600 | .000 | 20.0% | 0.0% | .375 |
| 2009 | Pittsburgh Pirates | 25 | 41 | 138 | 36 | 7 | 0 | 1 | 9 | 19 | 3 | 9 | 0 | .279 | .307 | .357 | .664 | .078 | 6.5% | 2.2% | .289 |
Posts about him
None yet.
Stats from the MLB Stats API, through Oct 9, 2026.