
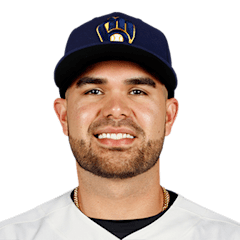
Renato Núñez
3B · Last on a Brewers farm club: Nashville Sounds, 2021
- B/T
- R/R
- Size
- 6' 1", 220 lb
- Born
- 1994-04-04 · Valencia, Venezuela
- Acquired
- —
- MLB debut
- 2016-09-12
The path and tables below cover his minor-league seasons with any club, as the MLB Stats API lists them, through 2026. His major-league seasons are in the "Major leagues" section.
Level path
- ROK2011DSL Athletics
- ROK2012AZL Athletics
- A2013Beloit Snappers
- A+2014Stockton Ports
- AA2015Midland RockHounds
- AAA2016Nashville Sounds
- AAA2017Nashville Sounds
- AAA2018Nashville Sounds
- AAA2018Norfolk Tides
- AAA2018
- AAA2021Toledo Mud Hens
- AAA2021Nashville Sounds
- AAA2021
Hitting
| Year | Lvl | Club | Age | Games played. | Plate appearances: every trip to the plate, walks and hit-by-pitches included. | Hits. | Doubles. | Triples. | Home runs. | Runs scored. | Runs batted in. | Walks. | Strikeouts. | Stolen bases. | Batting average: hits divided by at-bats. | On-base percentage: how often he reaches base by a hit, walk or hit-by-pitch. | Slugging percentage: total bases divided by at-bats. | On-base plus slugging: OBP and SLG added together. | Isolated power: SLG minus AVG. It counts only the extra bases. | Strikeout rate: strikeouts divided by plate appearances. | Walk rate: walks divided by plate appearances. | Batting average on balls in play: hits other than home runs, divided by at-bats that ended with the ball in play. |
|---|---|---|---|---|---|---|---|---|---|---|---|---|---|---|---|---|---|---|---|---|---|---|
| 2011 | ROK | DSL Athletics | 17 | 53 | 207 | 52 | 12 | 0 | 5 | 20 | 28 | 6 | 42 | 1 | .268 | .301 | .407 | .708 | .139 | 20.3% | 2.9% | .315 |
| 2012 | ROK | AZL Athletics | 18 | 42 | 186 | 52 | 18 | 3 | 4 | 31 | 42 | 17 | 32 | 4 | .325 | .403 | .550 | .953 | .225 | 17.2% | 9.1% | .378 |
| 2013 | A | Beloit Snappers | 19 | 128 | 546 | 131 | 27 | 0 | 19 | 68 | 85 | 28 | 136 | 2 | .258 | .301 | .423 | .724 | .165 | 24.9% | 5.1% | .315 |
| 2014 | A+ | Stockton Ports | 20 | 124 | 563 | 142 | 28 | 3 | 29 | 75 | 96 | 34 | 113 | 2 | .279 | .336 | .517 | .853 | .238 | 20.1% | 6.0% | .303 |
| 2015 | AA | Midland RockHounds | 21 | 93 | 416 | 106 | 23 | 0 | 18 | 62 | 61 | 28 | 66 | 1 | .278 | .332 | .480 | .812 | .202 | 15.9% | 6.7% | .293 |
| 2016 | AAA | Nashville Sounds | 22 | 128 | 550 | 115 | 20 | 2 | 23 | 61 | 75 | 31 | 119 | 2 | .228 | .278 | .412 | .690 | .184 | 21.6% | 5.6% | .249 |
| 2017 | AAA | Nashville Sounds | 23 | 126 | 533 | 118 | 27 | 2 | 32 | 74 | 78 | 47 | 141 | 2 | .249 | .319 | .518 | .837 | .269 | 26.5% | 8.8% | .279 |
| 2018 | AAA | Nashville Sounds | 24 | 7 | 30 | 10 | 0 | 0 | 0 | 3 | 4 | 2 | 6 | 0 | .357 | .400 | .357 | .757 | .000 | 20.0% | 6.7% | .455 |
| 2018 | AAA | Norfolk Tides | 24 | 56 | 228 | 58 | 14 | 1 | 5 | 25 | 25 | 23 | 49 | 1 | .289 | .361 | .443 | .804 | .154 | 21.5% | 10.1% | .356 |
| 2018 | AAA | — | 24 | 63 | 258 | 68 | 14 | 1 | 5 | 28 | 29 | 25 | 55 | 1 | .297 | .366 | .432 | .798 | .135 | 21.3% | 9.7% | .368 |
| 2021 | AAA | Toledo Mud Hens | 27 | 74 | 311 | 77 | 14 | 2 | 20 | 59 | 64 | 30 | 76 | 1 | .291 | .383 | .585 | .968 | .294 | 24.4% | 9.6% | .329 |
| 2021 | AAA | Nashville Sounds | 27 | 21 | 75 | 12 | 2 | 0 | 1 | 7 | 4 | 6 | 17 | 0 | .179 | .267 | .254 | .521 | .075 | 22.7% | 8.0% | .224 |
| 2021 | AAA | — | 27 | 95 | 386 | 89 | 16 | 2 | 21 | 66 | 68 | 36 | 93 | 1 | .268 | .360 | .518 | .878 | .250 | 24.1% | 9.3% | .306 |
OPS by game
No 2026 game log on record, so there is no chart.
Major leagues
Hitting
| Year | Club | Age | Games played. | Plate appearances: every trip to the plate, walks and hit-by-pitches included. | Hits. | Doubles. | Triples. | Home runs. | Runs scored. | Runs batted in. | Walks. | Strikeouts. | Stolen bases. | Batting average: hits divided by at-bats. | On-base percentage: how often he reaches base by a hit, walk or hit-by-pitch. | Slugging percentage: total bases divided by at-bats. | On-base plus slugging: OBP and SLG added together. | Isolated power: SLG minus AVG. It counts only the extra bases. | Strikeout rate: strikeouts divided by plate appearances. | Walk rate: walks divided by plate appearances. | Batting average on balls in play: hits other than home runs, divided by at-bats that ended with the ball in play. |
|---|---|---|---|---|---|---|---|---|---|---|---|---|---|---|---|---|---|---|---|---|---|
| 2016 | Oakland Athletics | 22 | 9 | 15 | 2 | 0 | 0 | 0 | 0 | 1 | 0 | 3 | 0 | .133 | .133 | .133 | .266 | .000 | 20.0% | 0.0% | .167 |
| 2017 | Oakland Athletics | 23 | 8 | 16 | 3 | 0 | 0 | 1 | 1 | 3 | 1 | 8 | 0 | .200 | .250 | .400 | .650 | .200 | 50.0% | 6.3% | .333 |
| 2018 | Texas Rangers | 24 | 13 | 41 | 6 | 1 | 0 | 1 | 2 | 2 | 3 | 12 | 0 | .167 | .244 | .278 | .522 | .111 | 29.3% | 7.3% | .208 |
| 2018 | Baltimore Orioles | 24 | 60 | 220 | 55 | 13 | 0 | 7 | 26 | 20 | 16 | 50 | 0 | .275 | .336 | .445 | .781 | .170 | 22.7% | 7.3% | .333 |
| 2018 | 2 teams | 24 | 73 | 261 | 61 | 14 | 0 | 8 | 28 | 22 | 19 | 62 | 0 | .258 | .322 | .419 | .741 | .161 | 23.8% | 7.3% | .315 |
| 2019 | Baltimore Orioles | 25 | 151 | 599 | 132 | 24 | 0 | 31 | 72 | 90 | 44 | 143 | 1 | .244 | .311 | .460 | .771 | .216 | 23.9% | 7.3% | .272 |
| 2020 | Baltimore Orioles | 26 | 52 | 216 | 50 | 10 | 0 | 12 | 29 | 31 | 17 | 64 | 0 | .256 | .324 | .492 | .816 | .236 | 29.6% | 7.9% | .317 |
| 2021 | Detroit Tigers | 27 | 14 | 55 | 10 | 3 | 0 | 4 | 7 | 7 | 1 | 16 | 0 | .189 | .218 | .472 | .690 | .283 | 29.1% | 1.8% | .182 |
Posts about him
None yet.
Stats from the MLB Stats API, through Oct 9, 2026.