
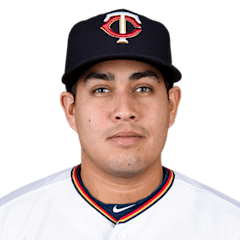
Ramón Flores
RF · Last on a Brewers farm club: Colorado Springs Sky Sox, 2016
- B/T
- L/L
- Size
- 5' 10", 190 lb
- Born
- 1992-03-26 · Barinas, Venezuela
- Acquired
- —
- MLB debut
- 2015-05-30
The path and tables below cover his minor-league seasons with any club, as the MLB Stats API lists them, through 2026. His major-league seasons are in the "Major leagues" section.
Level path
- ROK2009DSL Yankees 2
- ROK2009GCL Yankees
- ROK2009
- ROK2010GCL Yankees
- A2010Charleston RiverDogs
- A+2010Tampa Yankees
- A2011Charleston RiverDogs
- A+2012Tampa Yankees
- AA2012Trenton Thunder
- AA2013Trenton Thunder
- ROK2014GCL Yankees2
- ROK2014GCL Yankees1
- ROK2014
- AAA2014Scranton/Wilkes-Barre RailRiders
- AAA2015Scranton/Wilkes-Barre RailRiders
- AAA2015Tacoma Rainiers
- AAA2015
- AAA2016Colorado Springs Sky Sox
- AAA2017Salt Lake Bees
- AAA2018Pawtucket Red Sox
- AAA2019Rochester Red Wings
- AA2021Harrisburg Senators
- AAA2021Rochester Red Wings
Hitting
| Year | Lvl | Club | Age | Games played. | Plate appearances: every trip to the plate, walks and hit-by-pitches included. | Hits. | Doubles. | Triples. | Home runs. | Runs scored. | Runs batted in. | Walks. | Strikeouts. | Stolen bases. | Batting average: hits divided by at-bats. | On-base percentage: how often he reaches base by a hit, walk or hit-by-pitch. | Slugging percentage: total bases divided by at-bats. | On-base plus slugging: OBP and SLG added together. | Isolated power: SLG minus AVG. It counts only the extra bases. | Strikeout rate: strikeouts divided by plate appearances. | Walk rate: walks divided by plate appearances. | Batting average on balls in play: hits other than home runs, divided by at-bats that ended with the ball in play. |
|---|---|---|---|---|---|---|---|---|---|---|---|---|---|---|---|---|---|---|---|---|---|---|
| 2009 | ROK | DSL Yankees 2 | 17 | 11 | 52 | 10 | 0 | 3 | 1 | 8 | 5 | 11 | 5 | 0 | .256 | .423 | .487 | .910 | .231 | 9.6% | 21.2% | .265 |
| 2009 | ROK | GCL Yankees | 17 | 51 | 187 | 31 | 5 | 1 | 0 | 14 | 14 | 22 | 35 | 7 | .196 | .303 | .241 | .544 | .045 | 18.7% | 11.8% | .248 |
| 2009 | ROK | — | 17 | 62 | 239 | 41 | 5 | 4 | 1 | 22 | 19 | 33 | 40 | 7 | .208 | .329 | .289 | .618 | .081 | 16.7% | 13.8% | .252 |
| 2010 | ROK | GCL Yankees | 18 | 43 | 189 | 52 | 10 | 4 | 2 | 33 | 22 | 28 | 22 | 4 | .329 | .436 | .481 | .917 | .152 | 11.6% | 14.8% | .373 |
| 2010 | A | Charleston RiverDogs | 18 | 14 | 51 | 12 | 3 | 0 | 0 | 3 | 2 | 3 | 15 | 1 | .250 | .294 | .313 | .607 | .063 | 29.4% | 5.9% | .364 |
| 2010 | A+ | Tampa Yankees | 18 | 8 | 28 | 7 | 0 | 0 | 0 | 0 | 2 | 0 | 5 | 0 | .250 | .250 | .250 | .500 | .000 | 17.9% | 0.0% | .304 |
| 2011 | A | Charleston RiverDogs | 19 | 125 | 534 | 124 | 26 | 2 | 11 | 59 | 59 | 61 | 93 | 13 | .265 | .353 | .400 | .753 | .135 | 17.4% | 11.4% | .310 |
| 2012 | A+ | Tampa Yankees | 20 | 131 | 583 | 156 | 29 | 7 | 6 | 83 | 39 | 54 | 85 | 24 | .302 | .370 | .420 | .790 | .118 | 14.6% | 9.3% | .348 |
| 2012 | AA | Trenton Thunder | 20 | 1 | 5 | 2 | 0 | 0 | 1 | 2 | 2 | 0 | 0 | 0 | .400 | .400 | 1.000 | 1.400 | .600 | 0.0% | 0.0% | .250 |
| 2013 | AA | Trenton Thunder | 21 | 136 | 620 | 139 | 25 | 6 | 6 | 79 | 55 | 77 | 98 | 7 | .260 | .353 | .363 | .716 | .103 | 15.8% | 12.4% | .306 |
| 2014 | ROK | GCL Yankees2 | 22 | 3 | 10 | 3 | 1 | 0 | 1 | 2 | 1 | 1 | 3 | 0 | .333 | .400 | .778 | 1.178 | .445 | 30.0% | 10.0% | .400 |
| 2014 | ROK | GCL Yankees1 | 22 | 2 | 8 | 3 | 2 | 0 | 1 | 2 | 2 | 0 | 2 | 0 | .375 | .375 | 1.000 | 1.375 | .625 | 25.0% | 0.0% | .400 |
| 2014 | ROK | — | 22 | 5 | 18 | 6 | 3 | 0 | 2 | 4 | 3 | 1 | 5 | 0 | .353 | .389 | .882 | 1.271 | .529 | 27.8% | 5.6% | .400 |
| 2014 | AAA | Scranton/Wilkes-Barre RailRiders | 22 | 63 | 271 | 58 | 17 | 4 | 7 | 30 | 23 | 33 | 45 | 3 | .247 | .339 | .443 | .782 | .196 | 16.6% | 12.2% | .276 |
| 2015 | AAA | Scranton/Wilkes-Barre RailRiders | 23 | 73 | 321 | 79 | 11 | 2 | 7 | 43 | 34 | 39 | 43 | 3 | .286 | .377 | .417 | .794 | .131 | 13.4% | 12.1% | .314 |
| 2015 | AAA | Tacoma Rainiers | 23 | 14 | 63 | 22 | 6 | 0 | 2 | 11 | 7 | 11 | 6 | 0 | .423 | .524 | .654 | 1.178 | .231 | 9.5% | 17.5% | .455 |
| 2015 | AAA | — | 23 | 87 | 384 | 101 | 17 | 2 | 9 | 54 | 41 | 50 | 49 | 3 | .308 | .401 | .454 | .855 | .146 | 12.8% | 13.0% | .337 |
| 2016 | AAA | Colorado Springs Sky Sox | 24 | 8 | 31 | 7 | 1 | 0 | 1 | 3 | 2 | 2 | 7 | 0 | .250 | .290 | .393 | .683 | .143 | 22.6% | 6.5% | .286 |
| 2017 | AAA | Salt Lake Bees | 25 | 115 | 493 | 129 | 21 | 5 | 10 | 65 | 71 | 68 | 70 | 12 | .312 | .409 | .460 | .869 | .148 | 14.2% | 13.8% | .353 |
| 2018 | AAA | Pawtucket Red Sox | 26 | 56 | 223 | 42 | 7 | 1 | 3 | 13 | 17 | 23 | 42 | 2 | .215 | .299 | .308 | .607 | .093 | 18.8% | 10.3% | .257 |
| 2019 | AAA | Rochester Red Wings | 27 | 30 | 131 | 33 | 4 | 1 | 3 | 19 | 17 | 23 | 22 | 2 | .308 | .435 | .449 | .884 | .141 | 16.8% | 17.6% | .366 |
| 2021 | AA | Harrisburg Senators | 29 | 16 | 46 | 5 | 0 | 0 | 0 | 4 | 2 | 7 | 13 | 0 | .132 | .261 | .132 | .393 | .000 | 28.3% | 15.2% | .192 |
| 2021 | AAA | Rochester Red Wings | 29 | 9 | 26 | 3 | 0 | 0 | 0 | 4 | 0 | 5 | 4 | 0 | .143 | .308 | .143 | .451 | .000 | 15.4% | 19.2% | .176 |
OPS by game
No 2026 game log on record, so there is no chart.
Major leagues
Hitting
| Year | Club | Age | Games played. | Plate appearances: every trip to the plate, walks and hit-by-pitches included. | Hits. | Doubles. | Triples. | Home runs. | Runs scored. | Runs batted in. | Walks. | Strikeouts. | Stolen bases. | Batting average: hits divided by at-bats. | On-base percentage: how often he reaches base by a hit, walk or hit-by-pitch. | Slugging percentage: total bases divided by at-bats. | On-base plus slugging: OBP and SLG added together. | Isolated power: SLG minus AVG. It counts only the extra bases. | Strikeout rate: strikeouts divided by plate appearances. | Walk rate: walks divided by plate appearances. | Batting average on balls in play: hits other than home runs, divided by at-bats that ended with the ball in play. |
|---|---|---|---|---|---|---|---|---|---|---|---|---|---|---|---|---|---|---|---|---|---|
| 2015 | New York Yankees | 23 | 12 | 33 | 7 | 1 | 0 | 0 | 3 | 0 | 0 | 4 | 0 | .219 | .219 | .250 | .469 | .031 | 12.1% | 0.0% | .250 |
| 2016 | Milwaukee Brewers | 24 | 104 | 289 | 51 | 8 | 0 | 2 | 18 | 19 | 31 | 58 | 3 | .205 | .294 | .261 | .555 | .056 | 20.1% | 10.7% | .254 |
| 2017 | Los Angeles Angels | 25 | 3 | 9 | 1 | 0 | 0 | 0 | 0 | 1 | 0 | 1 | 0 | .125 | .111 | .125 | .236 | .000 | 11.1% | 0.0% | .125 |
Posts about him
None yet.
Stats from the MLB Stats API, through Oct 9, 2026.