
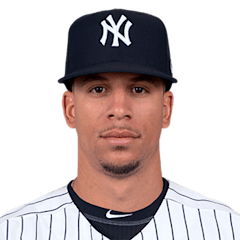
Quintin Berry
LF · Last on a Brewers farm club: Biloxi Shuckers, 2018
- B/T
- L/L
- Size
- 6' 1", 195 lb
- Born
- 1984-11-21 · San Diego, CA, USA
- Acquired
- Drafted 2006, round 5, pick 157, by Philadelphia Phillies
- MLB debut
- 2012-05-23
The path and tables below cover his minor-league seasons with any club, as the MLB Stats API lists them, through 2026. His major-league seasons are in the "Major leagues" section.
Level path
- SS-A2006Batavia Muckdogs
- A2007Lakewood BlueClaws
- A+2008Clearwater Threshers
- AA2009Reading Phillies
- AA2010Reading Phillies
- AA2010San Antonio Missions
- AA2010
- AA2011Carolina Mudcats
- AAA2011Louisville Bats
- AAA2012Toledo Mud Hens
- AAA2013Toledo Mud Hens
- AAA2013Omaha Storm Chasers
- AAA2013Pawtucket Red Sox
- AAA2013
- AAA2014Norfolk Tides
- AAA2015Pawtucket Red Sox
- AAA2015Iowa Cubs
- AAA2015
- AAA2016Salt Lake Bees
- AAA2016Buffalo Bisons
- AAA2016
- AAA2017Rochester Red Wings
- AAA2017Colorado Springs Sky Sox
- AAA2017
- AA2018Biloxi Shuckers
- AAA2018Colorado Springs Sky Sox
- AAA2018Scranton/Wilkes-Barre RailRiders
- AAA2018
Hitting
| Year | Lvl | Club | Age | Games played. | Plate appearances: every trip to the plate, walks and hit-by-pitches included. | Hits. | Doubles. | Triples. | Home runs. | Runs scored. | Runs batted in. | Walks. | Strikeouts. | Stolen bases. | Batting average: hits divided by at-bats. | On-base percentage: how often he reaches base by a hit, walk or hit-by-pitch. | Slugging percentage: total bases divided by at-bats. | On-base plus slugging: OBP and SLG added together. | Isolated power: SLG minus AVG. It counts only the extra bases. | Strikeout rate: strikeouts divided by plate appearances. | Walk rate: walks divided by plate appearances. | Batting average on balls in play: hits other than home runs, divided by at-bats that ended with the ball in play. |
|---|---|---|---|---|---|---|---|---|---|---|---|---|---|---|---|---|---|---|---|---|---|---|
| 2006 | SS-A | Batavia Muckdogs | 21 | 62 | 247 | 46 | 2 | 2 | 0 | 34 | 13 | 25 | 51 | 19 | .219 | .314 | .248 | .562 | .029 | 20.6% | 10.1% | .286 |
| 2007 | A | Lakewood BlueClaws | 22 | 126 | 581 | 152 | 19 | 4 | 3 | 86 | 44 | 61 | 85 | 55 | .312 | .395 | .386 | .781 | .074 | 14.6% | 10.5% | .365 |
| 2008 | A+ | Clearwater Threshers | 23 | 134 | 590 | 139 | 24 | 1 | 3 | 63 | 43 | 65 | 103 | 51 | .272 | .360 | .341 | .701 | .069 | 17.5% | 11.0% | .335 |
| 2009 | AA | Reading Phillies | 24 | 135 | 598 | 137 | 17 | 2 | 5 | 89 | 28 | 63 | 118 | 48 | .266 | .355 | .335 | .690 | .069 | 19.7% | 10.5% | .336 |
| 2010 | AA | Reading Phillies | 25 | 66 | 285 | 50 | 10 | 2 | 2 | 35 | 25 | 33 | 50 | 23 | .210 | .312 | .294 | .606 | .084 | 17.5% | 11.6% | .255 |
| 2010 | AA | San Antonio Missions | 25 | 33 | 124 | 23 | 1 | 1 | 1 | 11 | 8 | 10 | 28 | 4 | .209 | .293 | .264 | .557 | .055 | 22.6% | 8.1% | .272 |
| 2010 | AA | — | 25 | 99 | 409 | 73 | 11 | 3 | 3 | 46 | 33 | 43 | 78 | 27 | .210 | .306 | .284 | .590 | .074 | 19.1% | 10.5% | .260 |
| 2011 | AA | Carolina Mudcats | 26 | 93 | 378 | 95 | 16 | 1 | 6 | 63 | 41 | 51 | 83 | 40 | .296 | .396 | .408 | .804 | .112 | 22.0% | 13.5% | .382 |
| 2011 | AAA | Louisville Bats | 26 | 4 | 19 | 1 | 0 | 0 | 0 | 2 | 0 | 0 | 4 | 2 | .056 | .056 | .056 | .112 | .000 | 21.1% | 0.0% | .071 |
| 2012 | AAA | Toledo Mud Hens | 27 | 39 | 187 | 43 | 8 | 0 | 0 | 18 | 11 | 22 | 46 | 19 | .270 | .368 | .321 | .689 | .051 | 24.6% | 11.8% | .377 |
| 2013 | AAA | Toledo Mud Hens | 28 | 49 | 199 | 28 | 8 | 0 | 1 | 16 | 15 | 23 | 45 | 15 | .168 | .278 | .234 | .512 | .066 | 22.6% | 11.6% | .221 |
| 2013 | AAA | Omaha Storm Chasers | 28 | 48 | 172 | 32 | 2 | 1 | 2 | 18 | 16 | 26 | 34 | 13 | .222 | .343 | .292 | .635 | .070 | 19.8% | 15.1% | .275 |
| 2013 | AAA | Pawtucket Red Sox | 28 | 3 | 10 | 1 | 0 | 0 | 0 | 1 | 0 | 1 | 2 | 2 | .125 | .300 | .125 | .425 | .000 | 20.0% | 10.0% | .167 |
| 2013 | AAA | — | 28 | 100 | 381 | 61 | 10 | 1 | 3 | 35 | 31 | 50 | 81 | 30 | .191 | .309 | .257 | .566 | .066 | 21.3% | 13.1% | .245 |
| 2014 | AAA | Norfolk Tides | 29 | 112 | 432 | 104 | 19 | 1 | 3 | 53 | 35 | 57 | 84 | 25 | .285 | .382 | .367 | .749 | .082 | 19.4% | 13.2% | .359 |
| 2015 | AAA | Pawtucket Red Sox | 30 | 106 | 426 | 82 | 7 | 1 | 4 | 44 | 36 | 51 | 89 | 35 | .228 | .329 | .287 | .616 | .059 | 20.9% | 12.0% | .288 |
| 2015 | AAA | Iowa Cubs | 30 | 5 | 17 | 2 | 0 | 0 | 0 | 0 | 2 | 2 | 7 | 0 | .143 | .250 | .143 | .393 | .000 | 41.2% | 11.8% | .286 |
| 2015 | AAA | — | 30 | 111 | 443 | 84 | 7 | 1 | 4 | 44 | 38 | 53 | 96 | 35 | .225 | .326 | .282 | .608 | .057 | 21.7% | 12.0% | .288 |
| 2016 | AAA | Salt Lake Bees | 31 | 100 | 395 | 93 | 12 | 2 | 1 | 46 | 32 | 38 | 79 | 35 | .270 | .348 | .325 | .673 | .055 | 20.0% | 9.6% | .343 |
| 2016 | AAA | Buffalo Bisons | 31 | 5 | 23 | 2 | 0 | 0 | 0 | 2 | 0 | 2 | 7 | 0 | .105 | .227 | .105 | .332 | .000 | 30.4% | 8.7% | .167 |
| 2016 | AAA | — | 31 | 105 | 418 | 95 | 12 | 2 | 1 | 48 | 32 | 40 | 86 | 35 | .261 | .341 | .313 | .654 | .052 | 20.6% | 9.6% | .336 |
| 2017 | AAA | Rochester Red Wings | 32 | 14 | 40 | 7 | 1 | 1 | 0 | 5 | 0 | 4 | 11 | 1 | .194 | .275 | .278 | .553 | .084 | 27.5% | 10.0% | .280 |
| 2017 | AAA | Colorado Springs Sky Sox | 32 | 10 | 48 | 12 | 1 | 0 | 2 | 9 | 3 | 5 | 9 | 2 | .286 | .375 | .452 | .827 | .166 | 18.8% | 10.4% | .323 |
| 2017 | AAA | — | 32 | 24 | 88 | 19 | 2 | 1 | 2 | 14 | 3 | 9 | 20 | 3 | .244 | .330 | .372 | .702 | .128 | 22.7% | 10.2% | .304 |
| 2018 | AA | Biloxi Shuckers | 33 | 1 | 5 | 1 | 0 | 0 | 0 | 2 | 0 | 1 | 1 | 0 | .250 | .400 | .250 | .650 | .000 | 20.0% | 20.0% | .333 |
| 2018 | AAA | Colorado Springs Sky Sox | 33 | 42 | 93 | 18 | 3 | 0 | 2 | 14 | 11 | 8 | 31 | 10 | .214 | .290 | .321 | .611 | .107 | 33.3% | 8.6% | .314 |
| 2018 | AAA | Scranton/Wilkes-Barre RailRiders | 33 | 7 | 13 | 2 | 1 | 0 | 0 | 1 | 0 | 0 | 3 | 0 | .154 | .154 | .231 | .385 | .077 | 23.1% | 0.0% | .200 |
| 2018 | AAA | — | 33 | 49 | 106 | 20 | 4 | 0 | 2 | 15 | 11 | 8 | 34 | 10 | .206 | .274 | .309 | .583 | .103 | 32.1% | 7.5% | .295 |
Pitching
| Year | Lvl | Club | Age | Games pitched in. | Games started. | Wins. | Losses. | Saves. | Innings pitched. The digit after the point is outs: 110.1 is 110 innings and one out. | Hits allowed. | Walks allowed. | Strikeouts. | Home runs allowed. | Earned run average: earned runs allowed per nine innings. | Walks plus hits allowed per inning pitched. | Strikeouts per nine innings. | Walks per nine innings. | Strikeout rate: strikeouts divided by batters faced. | Walk rate: walks divided by batters faced. | Strikeout rate minus walk rate, both as a share of batters faced. |
|---|---|---|---|---|---|---|---|---|---|---|---|---|---|---|---|---|---|---|---|---|
| 2015 | AAA | Pawtucket Red Sox | 30 | 1 | 0 | 0 | 1 | 0 | 0.2 | 0 | 5 | 0 | 0 | 27.00 | 7.50 | 0.00 | 67.50 | 0.0% | 71.4% | -71.4% |
| 2016 | AAA | Salt Lake Bees | 31 | 1 | 0 | 0 | 1 | 0 | 0.1 | 1 | 2 | 0 | 0 | 27.00 | 9.00 | 0.00 | 54.00 | 0.0% | 50.0% | -50.0% |
OPS by game
No 2026 game log on record, so there is no chart.
Major leagues
Hitting
| Year | Club | Age | Games played. | Plate appearances: every trip to the plate, walks and hit-by-pitches included. | Hits. | Doubles. | Triples. | Home runs. | Runs scored. | Runs batted in. | Walks. | Strikeouts. | Stolen bases. | Batting average: hits divided by at-bats. | On-base percentage: how often he reaches base by a hit, walk or hit-by-pitch. | Slugging percentage: total bases divided by at-bats. | On-base plus slugging: OBP and SLG added together. | Isolated power: SLG minus AVG. It counts only the extra bases. | Strikeout rate: strikeouts divided by plate appearances. | Walk rate: walks divided by plate appearances. | Batting average on balls in play: hits other than home runs, divided by at-bats that ended with the ball in play. |
|---|---|---|---|---|---|---|---|---|---|---|---|---|---|---|---|---|---|---|---|---|---|
| 2012 | Detroit Tigers | 27 | 94 | 330 | 75 | 10 | 6 | 2 | 44 | 29 | 25 | 80 | 21 | .258 | .330 | .354 | .684 | .096 | 24.2% | 7.6% | .348 |
| 2013 | Boston Red Sox | 28 | 13 | 9 | 5 | 0 | 0 | 1 | 5 | 4 | 1 | 2 | 3 | .625 | .667 | 1.000 | 1.667 | .375 | 22.2% | 11.1% | .800 |
| 2014 | Baltimore Orioles | 29 | 10 | 2 | 0 | 0 | 0 | 0 | 3 | 0 | 0 | 1 | 1 | .000 | .000 | .000 | .000 | .000 | 50.0% | 0.0% | .000 |
| 2015 | Chicago Cubs | 30 | 8 | 1 | 0 | 0 | 0 | 0 | 1 | 0 | 0 | 1 | 2 | .000 | .000 | .000 | .000 | .000 | 100.0% | 0.0% | — |
| 2017 | Milwaukee Brewers | 32 | 7 | 3 | 0 | 0 | 0 | 0 | 0 | 0 | 0 | 2 | 2 | .000 | .000 | .000 | .000 | .000 | 66.7% | 0.0% | .000 |
Posts about him
None yet.
Stats from the MLB Stats API, through Oct 9, 2026.