
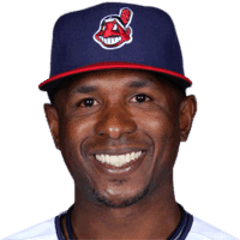
Nyjer Morgan
CF · Last on a Brewers farm club: Nashville Sounds, 2011
- B/T
- L/L
- Size
- 5' 10", 180 lb
- Born
- 1980-07-02 · San Francisco, CA, USA
- Acquired
- Drafted 2002, round 33, pick 973, by Pittsburgh Pirates
- MLB debut
- 2007-09-01
The path and tables below cover his minor-league seasons with any club, as the MLB Stats API lists them, through 2026. His major-league seasons are in the "Major leagues" section.
Level path
- SS-A2003Williamsport Crosscutters
- A2004Hickory Crawdads
- A+2005Lynchburg Hillcats
- A+2006Lynchburg Hillcats
- AA2006Altoona Curve
- ROK2007GCL Pirates
- AAA2007Indianapolis Indians
- AAA2008Indianapolis Indians
- A2010Hagerstown Suns
- A+2010Potomac Nationals
- AAA2011Nashville Sounds
- AAA2014Columbus Clippers
- AAA2016Pericos de Puebla
- AAA2017Acereros del Norte
Hitting
| Year | Lvl | Club | Age | Games played. | Plate appearances: every trip to the plate, walks and hit-by-pitches included. | Hits. | Doubles. | Triples. | Home runs. | Runs scored. | Runs batted in. | Walks. | Strikeouts. | Stolen bases. | Batting average: hits divided by at-bats. | On-base percentage: how often he reaches base by a hit, walk or hit-by-pitch. | Slugging percentage: total bases divided by at-bats. | On-base plus slugging: OBP and SLG added together. | Isolated power: SLG minus AVG. It counts only the extra bases. | Strikeout rate: strikeouts divided by plate appearances. | Walk rate: walks divided by plate appearances. | Batting average on balls in play: hits other than home runs, divided by at-bats that ended with the ball in play. |
|---|---|---|---|---|---|---|---|---|---|---|---|---|---|---|---|---|---|---|---|---|---|---|
| 2003 | SS-A | Williamsport Crosscutters | 22 | 72 | 324 | 92 | 7 | 4 | 0 | 49 | 23 | 33 | 44 | 26 | .343 | .439 | .399 | .838 | .056 | 13.6% | 10.2% | .411 |
| 2004 | A | Hickory Crawdads | 23 | 134 | 618 | 131 | 16 | 7 | 4 | 83 | 41 | 53 | 120 | 55 | .255 | .358 | .337 | .695 | .082 | 19.4% | 8.6% | .321 |
| 2005 | A+ | Lynchburg Hillcats | 24 | 60 | 277 | 72 | 12 | 3 | 0 | 36 | 24 | 11 | 40 | 24 | .286 | .328 | .357 | .685 | .071 | 14.4% | 4.0% | .333 |
| 2006 | A+ | Lynchburg Hillcats | 25 | 61 | 274 | 69 | 7 | 3 | 0 | 43 | 22 | 20 | 40 | 38 | .303 | .390 | .360 | .750 | .057 | 14.6% | 7.3% | .359 |
| 2006 | AA | Altoona Curve | 25 | 56 | 244 | 67 | 6 | 5 | 1 | 39 | 10 | 15 | 28 | 21 | .306 | .359 | .393 | .752 | .087 | 11.5% | 6.1% | .347 |
| 2007 | ROK | GCL Pirates | 26 | 4 | 16 | 4 | 0 | 0 | 1 | 3 | 1 | 2 | 3 | 0 | .308 | .438 | .538 | .976 | .230 | 18.8% | 12.5% | .333 |
| 2007 | AAA | Indianapolis Indians | 26 | 44 | 184 | 50 | 4 | 2 | 0 | 30 | 10 | 15 | 28 | 26 | .305 | .374 | .354 | .728 | .049 | 15.2% | 8.2% | .368 |
| 2008 | AAA | Indianapolis Indians | 27 | 82 | 352 | 96 | 13 | 4 | 1 | 54 | 33 | 18 | 47 | 44 | .298 | .349 | .373 | .722 | .075 | 13.4% | 5.1% | .347 |
| 2010 | A | Hagerstown Suns | 29 | 1 | 4 | 0 | 0 | 0 | 0 | 0 | 0 | 1 | 1 | 0 | .000 | .250 | .000 | .250 | .000 | 25.0% | 25.0% | .000 |
| 2010 | A+ | Potomac Nationals | 29 | 1 | 3 | 0 | 0 | 0 | 0 | 0 | 0 | 0 | 0 | 0 | .000 | .000 | .000 | .000 | .000 | 0.0% | 0.0% | .000 |
| 2011 | AAA | Nashville Sounds | 30 | 2 | 6 | 2 | 0 | 0 | 0 | 1 | 0 | 2 | 1 | 1 | .500 | .667 | .500 | 1.167 | .000 | 16.7% | 33.3% | .667 |
| 2014 | AAA | Columbus Clippers | 33 | 15 | 64 | 12 | 4 | 0 | 1 | 4 | 7 | 3 | 16 | 1 | .200 | .234 | .317 | .551 | .117 | 25.0% | 4.7% | .250 |
| 2016 | AAA | Pericos de Puebla | 35 | 101 | 440 | 113 | 25 | 2 | 11 | 66 | 58 | 52 | 54 | 22 | .306 | .402 | .474 | .876 | .168 | 12.3% | 11.8% | .331 |
| 2017 | AAA | Acereros del Norte | 36 | 3 | 13 | 1 | 0 | 0 | 0 | 4 | 0 | 2 | 1 | 0 | .111 | .385 | .111 | .496 | .000 | 7.7% | 15.4% | .125 |
OPS by game
No 2026 game log on record, so there is no chart.
Major leagues
Hitting
| Year | Club | Age | Games played. | Plate appearances: every trip to the plate, walks and hit-by-pitches included. | Hits. | Doubles. | Triples. | Home runs. | Runs scored. | Runs batted in. | Walks. | Strikeouts. | Stolen bases. | Batting average: hits divided by at-bats. | On-base percentage: how often he reaches base by a hit, walk or hit-by-pitch. | Slugging percentage: total bases divided by at-bats. | On-base plus slugging: OBP and SLG added together. | Isolated power: SLG minus AVG. It counts only the extra bases. | Strikeout rate: strikeouts divided by plate appearances. | Walk rate: walks divided by plate appearances. | Batting average on balls in play: hits other than home runs, divided by at-bats that ended with the ball in play. |
|---|---|---|---|---|---|---|---|---|---|---|---|---|---|---|---|---|---|---|---|---|---|
| 2007 | Pittsburgh Pirates | 26 | 28 | 118 | 32 | 3 | 4 | 1 | 15 | 7 | 9 | 19 | 7 | .299 | .359 | .430 | .789 | .131 | 16.1% | 7.6% | .356 |
| 2008 | Pittsburgh Pirates | 27 | 58 | 175 | 47 | 13 | 0 | 0 | 26 | 7 | 10 | 32 | 9 | .294 | .345 | .375 | .720 | .081 | 18.3% | 5.7% | .364 |
| 2009 | Pittsburgh Pirates | 28 | 71 | 321 | 77 | 6 | 5 | 2 | 39 | 27 | 29 | 49 | 18 | .277 | .351 | .356 | .707 | .079 | 15.3% | 9.0% | .325 |
| 2009 | Washington Nationals | 28 | 49 | 212 | 67 | 9 | 2 | 1 | 35 | 12 | 11 | 25 | 24 | .351 | .396 | .435 | .831 | .084 | 11.8% | 5.2% | .398 |
| 2009 | 2 teams | 28 | 120 | 533 | 144 | 15 | 7 | 3 | 74 | 39 | 40 | 74 | 42 | .307 | .369 | .388 | .757 | .081 | 13.9% | 7.5% | .355 |
| 2010 | Washington Nationals | 29 | 136 | 577 | 129 | 17 | 7 | 0 | 60 | 24 | 40 | 88 | 34 | .253 | .319 | .314 | .633 | .061 | 15.3% | 6.9% | .304 |
| 2011 | Milwaukee Brewers | 30 | 119 | 429 | 115 | 20 | 6 | 4 | 61 | 37 | 19 | 70 | 13 | .304 | .357 | .421 | .778 | .117 | 16.3% | 4.4% | .362 |
| 2012 | Milwaukee Brewers | 31 | 122 | 322 | 69 | 5 | 3 | 3 | 44 | 16 | 20 | 63 | 12 | .239 | .302 | .308 | .610 | .069 | 19.6% | 6.2% | .296 |
| 2014 | Cleveland Indians | 33 | 15 | 52 | 14 | 1 | 0 | 1 | 8 | 6 | 7 | 6 | 3 | .341 | .429 | .439 | .868 | .098 | 11.5% | 13.5% | .371 |
Posts about him
None yet.
Stats from the MLB Stats API, through Oct 9, 2026.