
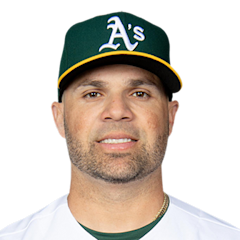
Manny Piña
C · Last on a Brewers farm club: Wisconsin Timber Rattlers, 2019
- B/T
- R/R
- Size
- 6' 0", 222 lb
- Born
- 1987-06-05 · Barquisimeto, Venezuela
- Acquired
- —
- MLB debut
- 2011-08-03
The path and tables below cover his minor-league seasons with any club, as the MLB Stats API lists them, through 2026. His major-league seasons are in the "Major leagues" section.
Level path
- ROK2005AZL Rangers
- ROK2006AZL Rangers
- A2007Clinton LumberKings
- A+2008Bakersfield Blaze
- AA2008Frisco RoughRiders
- AA2009Frisco RoughRiders
- AA2010Northwest Arkansas Naturals
- AAA2010Omaha Royals
- AA2011Northwest Arkansas Naturals
- AAA2011Omaha Storm Chasers
- ROK2012AZL Royals
- AA2012Northwest Arkansas Naturals
- AA2013Northwest Arkansas Naturals
- AAA2013Omaha Storm Chasers
- AA2014Jackson Generals
- AAA2014Tacoma Rainiers
- AAA2014Toledo Mud Hens
- AAA2014
- AAA2015Toledo Mud Hens
- AAA2016Colorado Springs Sky Sox
- A2018Wisconsin Timber Rattlers
- A2019Wisconsin Timber Rattlers
- A2023Stockton Ports
- AAA2023Las Vegas Aviators
Hitting
| Year | Lvl | Club | Age | Games played. | Plate appearances: every trip to the plate, walks and hit-by-pitches included. | Hits. | Doubles. | Triples. | Home runs. | Runs scored. | Runs batted in. | Walks. | Strikeouts. | Stolen bases. | Batting average: hits divided by at-bats. | On-base percentage: how often he reaches base by a hit, walk or hit-by-pitch. | Slugging percentage: total bases divided by at-bats. | On-base plus slugging: OBP and SLG added together. | Isolated power: SLG minus AVG. It counts only the extra bases. | Strikeout rate: strikeouts divided by plate appearances. | Walk rate: walks divided by plate appearances. | Batting average on balls in play: hits other than home runs, divided by at-bats that ended with the ball in play. |
|---|---|---|---|---|---|---|---|---|---|---|---|---|---|---|---|---|---|---|---|---|---|---|
| 2005 | ROK | AZL Rangers | 18 | 27 | 101 | 21 | 3 | 1 | 0 | 13 | 10 | 7 | 12 | 2 | .247 | .356 | .306 | .662 | .059 | 11.9% | 6.9% | .284 |
| 2006 | ROK | AZL Rangers | 19 | 14 | 50 | 11 | 4 | 0 | 0 | 1 | 3 | 2 | 4 | 0 | .244 | .300 | .333 | .633 | .089 | 8.0% | 4.0% | .262 |
| 2007 | A | Clinton LumberKings | 20 | 86 | 306 | 64 | 13 | 0 | 1 | 20 | 23 | 15 | 28 | 0 | .228 | .278 | .285 | .563 | .057 | 9.2% | 4.9% | .246 |
| 2008 | A+ | Bakersfield Blaze | 21 | 61 | 244 | 59 | 10 | 1 | 3 | 31 | 24 | 14 | 22 | 1 | .265 | .313 | .359 | .672 | .094 | 9.0% | 5.7% | .279 |
| 2008 | AA | Frisco RoughRiders | 21 | 23 | 89 | 22 | 7 | 0 | 0 | 7 | 9 | 5 | 12 | 1 | .275 | .330 | .363 | .693 | .088 | 13.5% | 5.6% | .319 |
| 2009 | AA | Frisco RoughRiders | 22 | 86 | 355 | 83 | 17 | 1 | 8 | 36 | 42 | 19 | 58 | 1 | .259 | .313 | .393 | .706 | .134 | 16.3% | 5.4% | .290 |
| 2010 | AA | Northwest Arkansas Naturals | 23 | 74 | 302 | 69 | 16 | 0 | 7 | 39 | 44 | 24 | 37 | 0 | .259 | .319 | .398 | .717 | .139 | 12.3% | 7.9% | .272 |
| 2010 | AAA | Omaha Royals | 23 | 17 | 60 | 12 | 2 | 0 | 2 | 5 | 5 | 3 | 7 | 0 | .218 | .267 | .364 | .631 | .146 | 11.7% | 5.0% | .213 |
| 2011 | AA | Northwest Arkansas Naturals | 24 | 3 | 10 | 2 | 1 | 0 | 0 | 0 | 3 | 2 | 3 | 0 | .250 | .400 | .375 | .775 | .125 | 30.0% | 20.0% | .400 |
| 2011 | AAA | Omaha Storm Chasers | 24 | 68 | 259 | 50 | 13 | 0 | 5 | 34 | 25 | 34 | 37 | 0 | .238 | .364 | .371 | .735 | .133 | 14.3% | 13.1% | .266 |
| 2012 | ROK | AZL Royals | 25 | 6 | 21 | 6 | 2 | 0 | 0 | 3 | 5 | 6 | 2 | 0 | .462 | .619 | .615 | 1.234 | .153 | 9.5% | 28.6% | .500 |
| 2012 | AA | Northwest Arkansas Naturals | 25 | 43 | 162 | 34 | 3 | 0 | 5 | 9 | 20 | 24 | 24 | 0 | .260 | .389 | .397 | .786 | .137 | 14.8% | 14.8% | .279 |
| 2013 | AA | Northwest Arkansas Naturals | 26 | 58 | 214 | 44 | 13 | 0 | 5 | 19 | 25 | 11 | 30 | 0 | .221 | .268 | .362 | .630 | .141 | 14.0% | 5.1% | .236 |
| 2013 | AAA | Omaha Storm Chasers | 26 | 28 | 111 | 24 | 5 | 0 | 2 | 7 | 13 | 6 | 10 | 1 | .242 | .287 | .354 | .641 | .112 | 9.0% | 5.4% | .247 |
| 2014 | AA | Jackson Generals | 27 | 17 | 69 | 17 | 4 | 0 | 2 | 11 | 10 | 8 | 8 | 0 | .279 | .362 | .443 | .805 | .164 | 11.6% | 11.6% | .294 |
| 2014 | AAA | Tacoma Rainiers | 27 | 4 | 14 | 3 | 1 | 0 | 0 | 1 | 3 | 0 | 2 | 0 | .214 | .214 | .286 | .500 | .072 | 14.3% | 0.0% | .250 |
| 2014 | AAA | Toledo Mud Hens | 27 | 38 | 154 | 37 | 4 | 0 | 3 | 18 | 16 | 11 | 19 | 2 | .268 | .320 | .362 | .682 | .094 | 12.3% | 7.1% | .286 |
| 2014 | AAA | — | 27 | 42 | 168 | 40 | 5 | 0 | 3 | 19 | 19 | 11 | 21 | 2 | .263 | .311 | .355 | .666 | .092 | 12.5% | 6.5% | .282 |
| 2015 | AAA | Toledo Mud Hens | 28 | 77 | 292 | 78 | 19 | 0 | 7 | 28 | 39 | 24 | 34 | 2 | .305 | .379 | .461 | .840 | .156 | 11.6% | 8.2% | .327 |
| 2016 | AAA | Colorado Springs Sky Sox | 29 | 63 | 262 | 78 | 21 | 3 | 5 | 35 | 43 | 17 | 39 | 1 | .329 | .371 | .506 | .877 | .177 | 14.9% | 6.5% | .371 |
| 2018 | A | Wisconsin Timber Rattlers | 31 | 1 | 4 | 1 | 0 | 0 | 0 | 0 | 0 | 1 | 0 | 0 | .333 | .500 | .333 | .833 | .000 | 0.0% | 25.0% | .333 |
| 2019 | A | Wisconsin Timber Rattlers | 32 | 4 | 15 | 3 | 0 | 0 | 0 | 1 | 2 | 1 | 4 | 0 | .231 | .333 | .231 | .564 | .000 | 26.7% | 6.7% | .333 |
| 2023 | A | Stockton Ports | 36 | 4 | 12 | 3 | 1 | 0 | 1 | 4 | 2 | 2 | 2 | 0 | .300 | .417 | .700 | 1.117 | .400 | 16.7% | 16.7% | .286 |
| 2023 | AAA | Las Vegas Aviators | 36 | 11 | 38 | 11 | 2 | 0 | 2 | 8 | 8 | 3 | 5 | 0 | .324 | .395 | .559 | .954 | .235 | 13.2% | 7.9% | .333 |
OPS by game
No 2026 game log on record, so there is no chart.
Major leagues
Hitting
| Year | Club | Age | Games played. | Plate appearances: every trip to the plate, walks and hit-by-pitches included. | Hits. | Doubles. | Triples. | Home runs. | Runs scored. | Runs batted in. | Walks. | Strikeouts. | Stolen bases. | Batting average: hits divided by at-bats. | On-base percentage: how often he reaches base by a hit, walk or hit-by-pitch. | Slugging percentage: total bases divided by at-bats. | On-base plus slugging: OBP and SLG added together. | Isolated power: SLG minus AVG. It counts only the extra bases. | Strikeout rate: strikeouts divided by plate appearances. | Walk rate: walks divided by plate appearances. | Batting average on balls in play: hits other than home runs, divided by at-bats that ended with the ball in play. |
|---|---|---|---|---|---|---|---|---|---|---|---|---|---|---|---|---|---|---|---|---|---|
| 2011 | Kansas City Royals | 24 | 4 | 15 | 3 | 2 | 0 | 0 | 2 | 0 | 1 | 2 | 0 | .214 | .267 | .357 | .624 | .143 | 13.3% | 6.7% | .250 |
| 2012 | Kansas City Royals | 25 | 1 | 2 | 0 | 0 | 0 | 0 | 0 | 0 | 0 | 0 | 0 | .000 | .000 | .000 | .000 | .000 | 0.0% | 0.0% | .000 |
| 2016 | Milwaukee Brewers | 29 | 33 | 81 | 18 | 4 | 0 | 2 | 4 | 12 | 10 | 15 | 0 | .254 | .346 | .394 | .740 | .140 | 18.5% | 12.3% | .296 |
| 2017 | Milwaukee Brewers | 30 | 107 | 359 | 92 | 21 | 0 | 9 | 45 | 43 | 20 | 79 | 2 | .279 | .327 | .424 | .751 | .145 | 22.0% | 5.6% | .339 |
| 2018 | Milwaukee Brewers | 31 | 98 | 337 | 77 | 13 | 2 | 9 | 39 | 28 | 21 | 62 | 2 | .252 | .307 | .395 | .702 | .143 | 18.4% | 6.2% | .285 |
| 2019 | Milwaukee Brewers | 32 | 76 | 179 | 36 | 8 | 0 | 7 | 10 | 25 | 16 | 50 | 0 | .228 | .313 | .411 | .724 | .183 | 27.9% | 8.9% | .284 |
| 2020 | Milwaukee Brewers | 33 | 15 | 45 | 9 | 1 | 0 | 2 | 4 | 5 | 3 | 11 | 0 | .231 | .333 | .410 | .743 | .179 | 24.4% | 6.7% | .269 |
| 2021 | Milwaukee Brewers | 34 | 75 | 208 | 34 | 6 | 0 | 13 | 27 | 33 | 22 | 38 | 0 | .189 | .293 | .439 | .732 | .250 | 18.3% | 10.6% | .162 |
| 2022 | Atlanta Braves | 35 | 5 | 17 | 2 | 0 | 0 | 0 | 1 | 2 | 1 | 1 | 0 | .143 | .235 | .143 | .378 | .000 | 5.9% | 5.9% | .143 |
| 2023 | Oakland Athletics | 36 | 4 | 12 | 3 | 0 | 0 | 1 | 1 | 1 | 0 | 3 | 0 | .250 | .250 | .500 | .750 | .250 | 25.0% | 0.0% | .250 |
Posts about him
None yet.
Stats from the MLB Stats API, through Oct 9, 2026.