
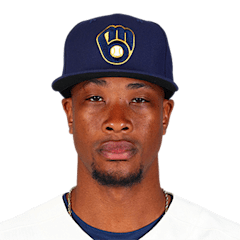
Keon Broxton
CF · Last on a Brewers farm club: Nashville Sounds, 2021
- B/T
- R/R
- Size
- 6' 3", 200 lb
- Born
- 1990-05-07 · Lakeland, FL, USA
- Acquired
- Drafted 2009, round 3, pick 95, by Arizona Diamondbacks
- MLB debut
- 2015-09-21
The path and tables below cover his minor-league seasons with any club, as the MLB Stats API lists them, through 2026. His major-league seasons are in the "Major leagues" section.
Level path
- ROK2009Missoula Osprey
- A2010South Bend Silver Hawks
- A2011South Bend Silver Hawks
- A+2011Visalia Rawhide
- A+2012Visalia Rawhide
- AA2013Mobile BayBears
- AA2014Altoona Curve
- AA2015Altoona Curve
- AAA2015Indianapolis Indians
- AAA2016Colorado Springs Sky Sox
- AAA2017Colorado Springs Sky Sox
- A2018Wisconsin Timber Rattlers
- AAA2018Colorado Springs Sky Sox
- ROK2021ACL Brewers Gold
- AAA2021St. Paul Saints
- AAA2021Nashville Sounds
- AAA2021
Hitting
| Year | Lvl | Club | Age | Games played. | Plate appearances: every trip to the plate, walks and hit-by-pitches included. | Hits. | Doubles. | Triples. | Home runs. | Runs scored. | Runs batted in. | Walks. | Strikeouts. | Stolen bases. | Batting average: hits divided by at-bats. | On-base percentage: how often he reaches base by a hit, walk or hit-by-pitch. | Slugging percentage: total bases divided by at-bats. | On-base plus slugging: OBP and SLG added together. | Isolated power: SLG minus AVG. It counts only the extra bases. | Strikeout rate: strikeouts divided by plate appearances. | Walk rate: walks divided by plate appearances. | Batting average on balls in play: hits other than home runs, divided by at-bats that ended with the ball in play. |
|---|---|---|---|---|---|---|---|---|---|---|---|---|---|---|---|---|---|---|---|---|---|---|
| 2009 | ROK | Missoula Osprey | 19 | 72 | 297 | 67 | 11 | 9 | 11 | 38 | 37 | 19 | 93 | 6 | .246 | .302 | .474 | .776 | .228 | 31.3% | 6.4% | .331 |
| 2010 | A | South Bend Silver Hawks | 20 | 133 | 603 | 121 | 17 | 19 | 5 | 74 | 32 | 65 | 172 | 21 | .228 | .316 | .360 | .676 | .132 | 28.5% | 10.8% | .328 |
| 2011 | A | South Bend Silver Hawks | 21 | 20 | 85 | 18 | 0 | 2 | 0 | 8 | 1 | 7 | 30 | 6 | .231 | .294 | .282 | .576 | .051 | 35.3% | 8.2% | .375 |
| 2011 | A+ | Visalia Rawhide | 21 | 110 | 483 | 102 | 14 | 5 | 7 | 69 | 44 | 62 | 142 | 27 | .251 | .349 | .362 | .711 | .111 | 29.4% | 12.8% | .360 |
| 2012 | A+ | Visalia Rawhide | 22 | 130 | 536 | 131 | 24 | 1 | 19 | 84 | 62 | 40 | 136 | 21 | .267 | .326 | .437 | .763 | .170 | 25.4% | 7.5% | .332 |
| 2013 | AA | Mobile BayBears | 23 | 101 | 372 | 77 | 13 | 3 | 8 | 40 | 41 | 30 | 116 | 5 | .231 | .296 | .359 | .655 | .128 | 31.2% | 8.1% | .325 |
| 2014 | AA | Altoona Curve | 24 | 127 | 471 | 112 | 22 | 9 | 15 | 67 | 52 | 59 | 122 | 25 | .275 | .369 | .484 | .853 | .209 | 25.9% | 12.5% | .357 |
| 2015 | AA | Altoona Curve | 25 | 45 | 204 | 54 | 12 | 4 | 3 | 35 | 26 | 19 | 51 | 11 | .302 | .365 | .464 | .829 | .162 | 25.0% | 9.3% | .395 |
| 2015 | AAA | Indianapolis Indians | 25 | 88 | 367 | 80 | 15 | 8 | 7 | 51 | 42 | 47 | 105 | 28 | .256 | .352 | .423 | .775 | .167 | 28.6% | 12.8% | .356 |
| 2016 | AAA | Colorado Springs Sky Sox | 26 | 47 | 199 | 51 | 11 | 7 | 8 | 30 | 26 | 20 | 60 | 18 | .287 | .362 | .562 | .924 | .275 | 30.2% | 10.1% | .391 |
| 2017 | AAA | Colorado Springs Sky Sox | 27 | 7 | 34 | 10 | 2 | 0 | 1 | 4 | 7 | 7 | 8 | 4 | .385 | .500 | .577 | 1.077 | .192 | 23.5% | 20.6% | .500 |
| 2018 | A | Wisconsin Timber Rattlers | 28 | 3 | 14 | 2 | 0 | 0 | 0 | 1 | 0 | 2 | 7 | 2 | .167 | .286 | .167 | .453 | .000 | 50.0% | 14.3% | .400 |
| 2018 | AAA | Colorado Springs Sky Sox | 28 | 82 | 334 | 76 | 16 | 2 | 10 | 47 | 37 | 30 | 119 | 27 | .254 | .323 | .421 | .744 | .167 | 35.6% | 9.0% | .382 |
| 2021 | ROK | ACL Brewers Gold | 31 | 3 | 12 | 1 | 0 | 0 | 0 | 3 | 0 | 2 | 6 | 0 | .111 | .333 | .111 | .444 | .000 | 50.0% | 16.7% | .333 |
| 2021 | AAA | St. Paul Saints | 31 | 73 | 257 | 41 | 6 | 0 | 9 | 38 | 26 | 30 | 113 | 10 | .186 | .288 | .335 | .623 | .149 | 44.0% | 11.7% | .314 |
| 2021 | AAA | Nashville Sounds | 31 | 15 | 42 | 4 | 0 | 0 | 0 | 4 | 1 | 5 | 22 | 2 | .111 | .238 | .111 | .349 | .000 | 52.4% | 11.9% | .286 |
| 2021 | AAA | — | 31 | 88 | 299 | 45 | 6 | 0 | 9 | 42 | 27 | 35 | 135 | 12 | .175 | .281 | .304 | .585 | .129 | 45.2% | 11.7% | .310 |
OPS by game
No 2026 game log on record, so there is no chart.
Major leagues
Hitting
| Year | Club | Age | Games played. | Plate appearances: every trip to the plate, walks and hit-by-pitches included. | Hits. | Doubles. | Triples. | Home runs. | Runs scored. | Runs batted in. | Walks. | Strikeouts. | Stolen bases. | Batting average: hits divided by at-bats. | On-base percentage: how often he reaches base by a hit, walk or hit-by-pitch. | Slugging percentage: total bases divided by at-bats. | On-base plus slugging: OBP and SLG added together. | Isolated power: SLG minus AVG. It counts only the extra bases. | Strikeout rate: strikeouts divided by plate appearances. | Walk rate: walks divided by plate appearances. | Batting average on balls in play: hits other than home runs, divided by at-bats that ended with the ball in play. |
|---|---|---|---|---|---|---|---|---|---|---|---|---|---|---|---|---|---|---|---|---|---|
| 2015 | Pittsburgh Pirates | 25 | 7 | 2 | 0 | 0 | 0 | 0 | 3 | 0 | 0 | 1 | 1 | .000 | .000 | .000 | .000 | .000 | 50.0% | 0.0% | .000 |
| 2016 | Milwaukee Brewers | 26 | 75 | 244 | 50 | 10 | 1 | 9 | 28 | 19 | 36 | 88 | 23 | .242 | .354 | .430 | .784 | .188 | 36.1% | 14.8% | .373 |
| 2017 | Milwaukee Brewers | 27 | 143 | 463 | 91 | 15 | 4 | 20 | 66 | 49 | 40 | 175 | 21 | .220 | .299 | .420 | .719 | .200 | 37.8% | 8.6% | .323 |
| 2018 | Milwaukee Brewers | 28 | 51 | 89 | 14 | 2 | 2 | 4 | 15 | 11 | 11 | 28 | 5 | .179 | .281 | .410 | .691 | .231 | 31.5% | 12.4% | .217 |
| 2019 | New York Mets | 29 | 34 | 53 | 7 | 1 | 0 | 0 | 5 | 2 | 4 | 22 | 4 | .143 | .208 | .163 | .371 | .020 | 41.5% | 7.5% | .259 |
| 2019 | Baltimore Orioles | 29 | 37 | 112 | 21 | 3 | 0 | 4 | 14 | 9 | 8 | 49 | 4 | .204 | .261 | .350 | .611 | .146 | 43.8% | 7.1% | .340 |
| 2019 | Seattle Mariners | 29 | 29 | 63 | 6 | 0 | 0 | 2 | 5 | 5 | 8 | 33 | 2 | .115 | .238 | .231 | .469 | .116 | 52.4% | 12.7% | .211 |
| 2019 | 3 teams | 29 | 100 | 228 | 34 | 4 | 0 | 6 | 24 | 16 | 20 | 104 | 10 | .167 | .242 | .275 | .517 | .108 | 45.6% | 8.8% | .292 |
Posts about him
None yet.
Stats from the MLB Stats API, through Oct 9, 2026.