
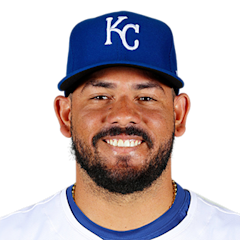
Jorge Alfaro
C · Last on a Brewers farm club: Nashville Sounds, 2025
- B/T
- R/R
- Size
- 6' 1", 243 lb
- Born
- 1993-06-11 · Sincelejo, Colombia
- Acquired
- —
- MLB debut
- 2016-09-12
The path and tables below cover his minor-league seasons with any club, as the MLB Stats API lists them, through 2026. His major-league seasons are in the "Major leagues" section.
Level path
- ROK2010DSL Rangers
- SS-A2011Spokane Indians
- A2012Hickory Crawdads
- ROK2013AZL Rangers
- A2013Hickory Crawdads
- A+2013Myrtle Beach Pelicans
- A+2014Myrtle Beach Pelicans
- AA2014Frisco RoughRiders
- ROK2015GCL Phillies
- AA2015Frisco RoughRiders
- AA2016Reading Fightin Phils
- AAA2017Lehigh Valley IronPigs
- AAA2021Jacksonville Jumbo Shrimp
- AAA2022El Paso Chihuahuas
- AAA2023Worcester Red Sox
- AAA2023Albuquerque Isotopes
- AAA2023Jacksonville Jumbo Shrimp
- AAA2023
- AAA2025Nashville Sounds
- AA2026Northwest Arkansas Naturals
- AAA2026Omaha Storm Chasers
Hitting
| Year | Lvl | Club | Age | Games played. | Plate appearances: every trip to the plate, walks and hit-by-pitches included. | Hits. | Doubles. | Triples. | Home runs. | Runs scored. | Runs batted in. | Walks. | Strikeouts. | Stolen bases. | Batting average: hits divided by at-bats. | On-base percentage: how often he reaches base by a hit, walk or hit-by-pitch. | Slugging percentage: total bases divided by at-bats. | On-base plus slugging: OBP and SLG added together. | Isolated power: SLG minus AVG. It counts only the extra bases. | Strikeout rate: strikeouts divided by plate appearances. | Walk rate: walks divided by plate appearances. | Batting average on balls in play: hits other than home runs, divided by at-bats that ended with the ball in play. |
|---|---|---|---|---|---|---|---|---|---|---|---|---|---|---|---|---|---|---|---|---|---|---|
| 2010 | ROK | DSL Rangers | 17 | 48 | 187 | 38 | 5 | 2 | 1 | 18 | 23 | 5 | 48 | 1 | .221 | .278 | .291 | .569 | .070 | 25.7% | 2.7% | .298 |
| 2011 | SS-A | Spokane Indians | 18 | 45 | 171 | 48 | 9 | 1 | 6 | 18 | 23 | 4 | 54 | 1 | .300 | .345 | .481 | .826 | .181 | 31.6% | 2.3% | .420 |
| 2012 | A | Hickory Crawdads | 19 | 74 | 300 | 71 | 21 | 5 | 5 | 40 | 34 | 16 | 84 | 7 | .261 | .320 | .430 | .750 | .169 | 28.0% | 5.3% | .355 |
| 2013 | ROK | AZL Rangers | 20 | 6 | 26 | 9 | 2 | 0 | 2 | 5 | 8 | 2 | 6 | 2 | .429 | .500 | .810 | 1.310 | .381 | 23.1% | 7.7% | .500 |
| 2013 | A | Hickory Crawdads | 20 | 104 | 420 | 96 | 22 | 1 | 16 | 63 | 53 | 28 | 111 | 16 | .258 | .338 | .452 | .790 | .194 | 26.4% | 6.7% | .324 |
| 2013 | A+ | Myrtle Beach Pelicans | 20 | 3 | 13 | 2 | 0 | 0 | 0 | 4 | 0 | 2 | 5 | 0 | .182 | .308 | .182 | .490 | .000 | 38.5% | 15.4% | .333 |
| 2014 | A+ | Myrtle Beach Pelicans | 21 | 100 | 437 | 104 | 22 | 5 | 13 | 63 | 73 | 23 | 100 | 6 | .261 | .318 | .440 | .758 | .179 | 22.9% | 5.3% | .315 |
| 2014 | AA | Frisco RoughRiders | 21 | 21 | 99 | 23 | 4 | 0 | 4 | 12 | 14 | 6 | 23 | 0 | .261 | .343 | .443 | .786 | .182 | 23.2% | 6.1% | .311 |
| 2015 | ROK | GCL Phillies | 22 | 3 | 6 | 2 | 1 | 0 | 0 | 0 | 1 | 0 | 0 | 0 | .500 | .667 | .750 | 1.417 | .250 | 0.0% | 0.0% | .500 |
| 2015 | AA | Frisco RoughRiders | 22 | 49 | 207 | 48 | 15 | 2 | 5 | 22 | 21 | 9 | 61 | 2 | .253 | .314 | .432 | .746 | .179 | 29.5% | 4.3% | .347 |
| 2016 | AA | Reading Fightin Phils | 23 | 97 | 435 | 115 | 21 | 2 | 15 | 68 | 67 | 22 | 105 | 3 | .285 | .325 | .458 | .783 | .173 | 24.1% | 5.1% | .347 |
| 2017 | AAA | Lehigh Valley IronPigs | 24 | 84 | 350 | 78 | 13 | 2 | 7 | 34 | 43 | 16 | 113 | 1 | .241 | .291 | .358 | .649 | .117 | 32.3% | 4.6% | .345 |
| 2021 | AAA | Jacksonville Jumbo Shrimp | 28 | 5 | 16 | 4 | 0 | 0 | 2 | 3 | 5 | 0 | 1 | 0 | .250 | .250 | .625 | .875 | .375 | 6.3% | 0.0% | .154 |
| 2022 | AAA | El Paso Chihuahuas | 29 | 4 | 16 | 4 | 1 | 0 | 2 | 5 | 4 | 1 | 5 | 0 | .267 | .313 | .733 | 1.046 | .466 | 31.3% | 6.3% | .250 |
| 2023 | AAA | Worcester Red Sox | 30 | 43 | 191 | 56 | 13 | 2 | 6 | 22 | 30 | 9 | 43 | 4 | .320 | .366 | .520 | .886 | .200 | 22.5% | 4.7% | .391 |
| 2023 | AAA | Albuquerque Isotopes | 30 | 3 | 14 | 5 | 0 | 0 | 1 | 2 | 3 | 0 | 5 | 1 | .357 | .357 | .571 | .928 | .214 | 35.7% | 0.0% | .500 |
| 2023 | AAA | Jacksonville Jumbo Shrimp | 30 | 18 | 73 | 13 | 4 | 0 | 0 | 3 | 6 | 5 | 17 | 0 | .200 | .274 | .262 | .536 | .062 | 23.3% | 6.8% | .265 |
| 2023 | AAA | — | 30 | 64 | 278 | 74 | 17 | 2 | 7 | 27 | 39 | 14 | 65 | 5 | .291 | .342 | .457 | .799 | .166 | 23.4% | 5.0% | .362 |
| 2025 | AAA | Nashville Sounds | 32 | 82 | 326 | 75 | 10 | 1 | 15 | 49 | 49 | 11 | 119 | 12 | .244 | .285 | .430 | .715 | .186 | 36.5% | 3.4% | .345 |
| 2026 | AA | Northwest Arkansas Naturals | 33 | 56 | 233 | 46 | 8 | 1 | 14 | 32 | 48 | 12 | 100 | 1 | .219 | .283 | .467 | .750 | .248 | 42.9% | 5.2% | .323 |
| 2026 | AAA | Omaha Storm Chasers | 33 | 6 | 25 | 6 | 2 | 0 | 1 | 2 | 3 | 1 | 7 | 0 | .261 | .320 | .478 | .798 | .217 | 28.0% | 4.0% | .333 |
OPS by game
No 2026 game log on record, so there is no chart.
Major leagues
Hitting
| Year | Club | Age | Games played. | Plate appearances: every trip to the plate, walks and hit-by-pitches included. | Hits. | Doubles. | Triples. | Home runs. | Runs scored. | Runs batted in. | Walks. | Strikeouts. | Stolen bases. | Batting average: hits divided by at-bats. | On-base percentage: how often he reaches base by a hit, walk or hit-by-pitch. | Slugging percentage: total bases divided by at-bats. | On-base plus slugging: OBP and SLG added together. | Isolated power: SLG minus AVG. It counts only the extra bases. | Strikeout rate: strikeouts divided by plate appearances. | Walk rate: walks divided by plate appearances. | Batting average on balls in play: hits other than home runs, divided by at-bats that ended with the ball in play. |
|---|---|---|---|---|---|---|---|---|---|---|---|---|---|---|---|---|---|---|---|---|---|
| 2016 | Philadelphia Phillies | 23 | 6 | 17 | 2 | 0 | 0 | 0 | 0 | 0 | 1 | 8 | 0 | .125 | .176 | .125 | .301 | .000 | 47.1% | 5.9% | .250 |
| 2017 | Philadelphia Phillies | 24 | 29 | 114 | 34 | 6 | 0 | 5 | 12 | 14 | 3 | 33 | 0 | .318 | .360 | .514 | .874 | .196 | 28.9% | 2.6% | .420 |
| 2018 | Philadelphia Phillies | 25 | 108 | 377 | 90 | 16 | 2 | 10 | 35 | 37 | 18 | 138 | 3 | .262 | .324 | .407 | .731 | .145 | 36.6% | 4.8% | .406 |
| 2019 | Miami Marlins | 26 | 130 | 465 | 113 | 14 | 1 | 18 | 44 | 57 | 22 | 154 | 4 | .262 | .312 | .425 | .737 | .163 | 33.1% | 4.7% | .364 |
| 2020 | Miami Marlins | 27 | 31 | 100 | 21 | 2 | 0 | 3 | 12 | 16 | 4 | 36 | 2 | .226 | .280 | .344 | .624 | .118 | 36.0% | 4.0% | .333 |
| 2021 | Miami Marlins | 28 | 92 | 311 | 72 | 15 | 1 | 4 | 22 | 30 | 11 | 99 | 8 | .244 | .283 | .342 | .625 | .098 | 31.8% | 3.5% | .354 |
| 2022 | San Diego Padres | 29 | 82 | 274 | 63 | 14 | 0 | 7 | 25 | 40 | 11 | 98 | 1 | .246 | .285 | .383 | .668 | .137 | 35.8% | 4.0% | .364 |
| 2023 | Colorado Rockies | 30 | 10 | 32 | 5 | 4 | 0 | 1 | 2 | 4 | 0 | 12 | 0 | .161 | .188 | .387 | .575 | .226 | 37.5% | 0.0% | .222 |
| 2023 | Boston Red Sox | 30 | 8 | 20 | 2 | 0 | 0 | 0 | 0 | 0 | 2 | 3 | 0 | .118 | .250 | .118 | .368 | .000 | 15.0% | 10.0% | .143 |
| 2023 | 2 teams | 30 | 18 | 52 | 7 | 4 | 0 | 1 | 2 | 4 | 2 | 15 | 0 | .146 | .212 | .292 | .504 | .146 | 28.8% | 3.8% | .188 |
| 2025 | Washington Nationals | 32 | 14 | 39 | 10 | 2 | 0 | 0 | 3 | 3 | 0 | 14 | 1 | .256 | .256 | .308 | .564 | .052 | 35.9% | 0.0% | .400 |
Posts about him
None yet.
Stats from the MLB Stats API, through Oct 9, 2026.