
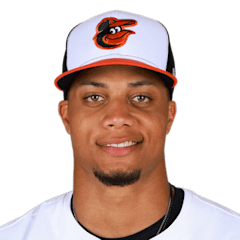
Jordyn Adams
CF · Biloxi Shuckers
- B/T
- R/R
- Size
- 6' 1", 181 lb
- Born
- 1999-10-18 · Gulfport, MS, USA
- Acquired
- Drafted 2018, round 1, pick 17, by Los Angeles Angels
- MLB debut
- 2023-08-02
Hitting .204/.264/.306 for Nashville Sounds. Small sample.
Level path
- ROK2018AZL Angels
- ROK2018Orem Owlz
- ROK2018
- ROK2019AZL Angels
- A2019Burlington Bees
- A+2019Inland Empire 66ers
- A+2021Tri-City Dust Devils
- A+2022Tri-City Dust Devils
- AA2022Rocket City Trash Pandas
- AAA2023Salt Lake Bees
- AAA2024Salt Lake Bees
- AA2025Chesapeake Baysox
- AAA2025Norfolk Tides
- AA2026Biloxi Shuckers
- AAA2026Nashville Sounds
Hitting
| Year | Lvl | Club | Age | Games played. | Plate appearances: every trip to the plate, walks and hit-by-pitches included. | Hits. | Doubles. | Triples. | Home runs. | Runs scored. | Runs batted in. | Walks. | Strikeouts. | Stolen bases. | Batting average: hits divided by at-bats. | On-base percentage: how often he reaches base by a hit, walk or hit-by-pitch. | Slugging percentage: total bases divided by at-bats. | On-base plus slugging: OBP and SLG added together. | Isolated power: SLG minus AVG. It counts only the extra bases. | Strikeout rate: strikeouts divided by plate appearances. | Walk rate: walks divided by plate appearances. | Batting average on balls in play: hits other than home runs, divided by at-bats that ended with the ball in play. |
|---|---|---|---|---|---|---|---|---|---|---|---|---|---|---|---|---|---|---|---|---|---|---|
| 2018 | ROK | AZL Angels | 18 | 20 | 82 | 17 | 2 | 2 | 0 | 8 | 5 | 10 | 23 | 5 | .243 | .354 | .329 | .683 | .086 | 28.0% | 12.2% | .362 |
| 2018 | ROK | Orem Owlz | 18 | 9 | 40 | 11 | 4 | 1 | 0 | 5 | 8 | 4 | 7 | 0 | .314 | .375 | .486 | .861 | .172 | 17.5% | 10.0% | .379 |
| 2018 | ROK | — | 18 | 29 | 122 | 28 | 6 | 3 | 0 | 13 | 13 | 14 | 30 | 5 | .267 | .361 | .381 | .742 | .114 | 24.6% | 11.5% | .368 |
| 2019 | ROK | AZL Angels | 19 | 3 | 14 | 7 | 1 | 0 | 0 | 4 | 4 | 1 | 3 | 4 | .538 | .571 | .615 | 1.186 | .077 | 21.4% | 7.1% | .700 |
| 2019 | A | Burlington Bees | 19 | 97 | 428 | 93 | 15 | 2 | 7 | 52 | 31 | 50 | 94 | 12 | .250 | .346 | .358 | .704 | .108 | 22.0% | 11.7% | .316 |
| 2019 | A+ | Inland Empire 66ers | 19 | 9 | 40 | 8 | 1 | 1 | 1 | 7 | 1 | 5 | 14 | 0 | .229 | .325 | .400 | .725 | .171 | 35.0% | 12.5% | .350 |
| 2021 | A+ | Tri-City Dust Devils | 21 | 71 | 307 | 60 | 7 | 2 | 5 | 37 | 27 | 28 | 116 | 18 | .217 | .290 | .310 | .600 | .093 | 37.8% | 9.1% | .350 |
| 2022 | A+ | Tri-City Dust Devils | 22 | 58 | 249 | 50 | 11 | 3 | 0 | 31 | 22 | 21 | 54 | 18 | .228 | .308 | .306 | .614 | .078 | 21.7% | 8.4% | .299 |
| 2022 | AA | Rocket City Trash Pandas | 22 | 62 | 236 | 52 | 7 | 2 | 4 | 33 | 20 | 21 | 70 | 15 | .249 | .326 | .359 | .685 | .110 | 29.7% | 8.9% | .350 |
| 2023 | AAA | Salt Lake Bees | 23 | 109 | 480 | 111 | 25 | 6 | 15 | 74 | 67 | 53 | 133 | 44 | .267 | .351 | .465 | .816 | .198 | 27.7% | 11.0% | .352 |
| 2024 | AAA | Salt Lake Bees | 24 | 123 | 549 | 126 | 22 | 4 | 10 | 78 | 58 | 51 | 148 | 28 | .261 | .333 | .386 | .719 | .125 | 27.0% | 9.3% | .352 |
| 2025 | AA | Chesapeake Baysox | 25 | 1 | 5 | 1 | 0 | 0 | 0 | 1 | 1 | 0 | 2 | 0 | .200 | .200 | .200 | .400 | .000 | 40.0% | 0.0% | .333 |
| 2025 | AAA | Norfolk Tides | 25 | 89 | 310 | 58 | 7 | 4 | 10 | 41 | 44 | 29 | 94 | 14 | .213 | .291 | .379 | .670 | .166 | 30.3% | 9.4% | .281 |
| 2026 | AA | Biloxi Shuckers | 26 | 12 | 51 | 8 | 1 | 0 | 3 | 8 | 10 | 7 | 14 | 3 | .190 | .333 | .429 | .762 | .239 | 27.5% | 13.7% | .200 |
| 2026 | AAA | Nashville Sounds | 26 | 15 | 54 | 10 | 1 | 2 | 0 | 7 | 6 | 3 | 20 | 4 | .204 | .264 | .306 | .570 | .102 | 37.0% | 5.6% | .345 |
Against Brewers farm peers
Hitting at Triple-A: 54 PA, under the minimum of 100 plate appearances in 2026, so no percentile.
Hitting at Double-A: 51 PA, under the minimum of 100 plate appearances in 2026, so no percentile.
OPS by game
- Below .500
- .500 to .799
- .800 to 1.099
- 1.100 and up
- Season OPS .661
- Rolling OPS, last 10 games
- Bar cut off at 2.000
Each bar is the OPS of one game, oldest on the left. One game is a tiny sample, so a single bar says little about a hitter. Season OPS adds up the 27 games that have a bar, so it can differ from the year-by-year table above.
The rolling line is the last 10 games. It draws only when those games hold at least 30 plate appearances.
The scale stops at 2.000. A bar with a chevron on top is higher than that. Its real OPS is in the table.
Table of every game
| Date | Club | Opponent | PA | OPS | Band |
|---|---|---|---|---|---|
| Apr 3 | Biloxi Shuckers | @ Rocket City Trash Pandas | 5 | .400 | Below .500 |
| Apr 4 | Biloxi Shuckers | @ Rocket City Trash Pandas | 5 | .400 | Below .500 |
| Apr 5 | Biloxi Shuckers | @ Rocket City Trash Pandas | 5 | 1.400 | 1.100 and up |
| Apr 7 | Biloxi Shuckers | Pensacola Blue Wahoos | 4 | .750 | .500 to .799 |
| Apr 8 | Biloxi Shuckers | Pensacola Blue Wahoos | 1 | .000 | Below .500 |
| Apr 16 | Biloxi Shuckers | @ Columbus Clingstones | 4 | .000 | Below .500 |
| Apr 17 | Biloxi Shuckers | @ Columbus Clingstones | 4 | .500 | .500 to .799 |
| Apr 18 | Biloxi Shuckers | @ Columbus Clingstones | 5 | .000 | Below .500 |
| Apr 19 | Biloxi Shuckers | @ Columbus Clingstones | 6 | .533 | .500 to .799 |
| Apr 21 | Biloxi Shuckers | Rocket City Trash Pandas | 4 | 2.417 | 1.100 and up (bar cut off at 2.000) |
| Apr 22 | Biloxi Shuckers | Rocket City Trash Pandas | 5 | 1.933 | 1.100 and up |
| Apr 23 | Biloxi Shuckers | Rocket City Trash Pandas | 3 | .333 | Below .500 |
| Apr 25 | Nashville Sounds | @ Charlotte Knights | 4 | .500 | .500 to .799 |
| Apr 25 (game 2) | Nashville Sounds | Charlotte Knights | 3 | 1.000 | .800 to 1.099 |
| Apr 26 | Nashville Sounds | @ Charlotte Knights | 4 | .000 | Below .500 |
| Apr 29 | Nashville Sounds | Norfolk Tides | 2 | .000 | Below .500 |
| Apr 30 (game 2) | Nashville Sounds | Norfolk Tides | 3 | 1.167 | 1.100 and up |
| May 1 | Nashville Sounds | Norfolk Tides | 4 | .250 | Below .500 |
| May 3 | Nashville Sounds | Norfolk Tides | 4 | .500 | .500 to .799 |
| May 6 | Nashville Sounds | @ Louisville Bats | 4 | .833 | .800 to 1.099 |
| May 7 | Nashville Sounds | @ Louisville Bats | 1 | 4.000 | 1.100 and up (bar cut off at 2.000) |
| May 8 | Nashville Sounds | @ Louisville Bats | 4 | 1.000 | .800 to 1.099 |
| May 9 | Nashville Sounds | @ Louisville Bats | 5 | .000 | Below .500 |
| May 10 | Nashville Sounds | @ Louisville Bats | 4 | 1.000 | .800 to 1.099 |
| May 14 | Nashville Sounds | Iowa Cubs | 4 | .000 | Below .500 |
| May 15 | Nashville Sounds | Iowa Cubs | 4 | .500 | .500 to .799 |
| May 20 | Nashville Sounds | @ Durham Bulls | 4 | .250 | Below .500 |
Game log
Hitting
| Date | Opp | W/L | Lvl | Club | Plate appearances: every trip to the plate, walks and hit-by-pitches included. | At-bats: plate appearances that are not walks, hit-by-pitches, sacrifices or interference. | Runs scored. | Hits. | Doubles. | Triples. | Home runs. | Runs batted in. | Walks. | Strikeouts. |
|---|---|---|---|---|---|---|---|---|---|---|---|---|---|---|
| May 20 | @ Durham Bulls | W | AAA | Nashville Sounds | 4 | 3 | 0 | 0 | 0 | 0 | 0 | 0 | 1 | 2 |
| May 15 | Iowa Cubs | W | AAA | Nashville Sounds | 4 | 4 | 1 | 1 | 0 | 0 | 0 | 0 | 0 | 2 |
| May 14 | Iowa Cubs | W | AAA | Nashville Sounds | 4 | 3 | 0 | 0 | 0 | 0 | 0 | 0 | 0 | 1 |
| May 10 | @ Louisville Bats | W | AAA | Nashville Sounds | 4 | 4 | 1 | 2 | 0 | 0 | 0 | 0 | 0 | 1 |
| May 9 | @ Louisville Bats | L | AAA | Nashville Sounds | 5 | 5 | 0 | 0 | 0 | 0 | 0 | 0 | 0 | 2 |
| May 8 | @ Louisville Bats | L | AAA | Nashville Sounds | 4 | 4 | 0 | 1 | 0 | 1 | 0 | 2 | 0 | 2 |
| May 7 | @ Louisville Bats | W | AAA | Nashville Sounds | 1 | 1 | 1 | 1 | 0 | 1 | 0 | 0 | 0 | 0 |
| May 6 | @ Louisville Bats | L | AAA | Nashville Sounds | 4 | 3 | 0 | 1 | 0 | 0 | 0 | 1 | 1 | 0 |
| May 3 | Norfolk Tides | W | AAA | Nashville Sounds | 4 | 4 | 1 | 1 | 0 | 0 | 0 | 1 | 0 | 1 |
| May 1 | Norfolk Tides | L | AAA | Nashville Sounds | 4 | 3 | 1 | 0 | 0 | 0 | 0 | 0 | 0 | 2 |
| Apr 30 | Norfolk Tides | W | AAA | Nashville Sounds | 3 | 2 | 0 | 1 | 0 | 0 | 0 | 0 | 1 | 1 |
| Apr 29 | Norfolk Tides | W | AAA | Nashville Sounds | 2 | 2 | 0 | 0 | 0 | 0 | 0 | 0 | 0 | 2 |
| Apr 26 | @ Charlotte Knights | W | AAA | Nashville Sounds | 4 | 4 | 1 | 0 | 0 | 0 | 0 | 0 | 0 | 2 |
| Apr 25 | Charlotte Knights | L | AAA | Nashville Sounds | 3 | 3 | 0 | 1 | 1 | 0 | 0 | 0 | 0 | 1 |
| Apr 25 | @ Charlotte Knights | W | AAA | Nashville Sounds | 4 | 4 | 1 | 1 | 0 | 0 | 0 | 2 | 0 | 1 |
| Apr 23 | Rocket City Trash Pandas | W | AA | Biloxi Shuckers | 3 | 2 | 1 | 0 | 0 | 0 | 0 | 0 | 1 | 0 |
| Apr 22 | Rocket City Trash Pandas | W | AA | Biloxi Shuckers | 5 | 3 | 2 | 1 | 0 | 0 | 1 | 1 | 2 | 1 |
| Apr 21 | Rocket City Trash Pandas | W | AA | Biloxi Shuckers | 4 | 3 | 3 | 2 | 0 | 0 | 1 | 3 | 1 | 1 |
| Apr 19 | @ Columbus Clingstones | L | AA | Biloxi Shuckers | 6 | 5 | 0 | 1 | 0 | 0 | 0 | 2 | 1 | 1 |
| Apr 18 | @ Columbus Clingstones | W | AA | Biloxi Shuckers | 5 | 5 | 0 | 0 | 0 | 0 | 0 | 0 | 0 | 2 |
| Apr 17 | @ Columbus Clingstones | L | AA | Biloxi Shuckers | 4 | 4 | 1 | 1 | 0 | 0 | 0 | 0 | 0 | 2 |
| Apr 16 | @ Columbus Clingstones | L | AA | Biloxi Shuckers | 4 | 4 | 0 | 0 | 0 | 0 | 0 | 0 | 0 | 1 |
| Apr 8 | Pensacola Blue Wahoos | W | AA | Biloxi Shuckers | 1 | 1 | 0 | 0 | 0 | 0 | 0 | 0 | 0 | 0 |
| Apr 7 | Pensacola Blue Wahoos | W | AA | Biloxi Shuckers | 4 | 4 | 0 | 1 | 1 | 0 | 0 | 0 | 0 | 3 |
| Apr 5 | @ Rocket City Trash Pandas | L | AA | Biloxi Shuckers | 5 | 5 | 1 | 2 | 0 | 0 | 1 | 2 | 0 | 0 |
| Apr 4 | @ Rocket City Trash Pandas | L | AA | Biloxi Shuckers | 5 | 3 | 0 | 0 | 0 | 0 | 0 | 1 | 1 | 1 |
| Apr 3 | @ Rocket City Trash Pandas | W | AA | Biloxi Shuckers | 5 | 3 | 0 | 0 | 0 | 0 | 0 | 1 | 1 | 2 |
A row is one game he played, newest first. A game he did not play has no row, so a log can have fewer rows than the G column above for the same season: a pitcher who batted once shows one hitting row. Season 2026, through May 20, 2026.
Major leagues
Hitting
| Year | Club | Age | Games played. | Plate appearances: every trip to the plate, walks and hit-by-pitches included. | Hits. | Doubles. | Triples. | Home runs. | Runs scored. | Runs batted in. | Walks. | Strikeouts. | Stolen bases. | Batting average: hits divided by at-bats. | On-base percentage: how often he reaches base by a hit, walk or hit-by-pitch. | Slugging percentage: total bases divided by at-bats. | On-base plus slugging: OBP and SLG added together. | Isolated power: SLG minus AVG. It counts only the extra bases. | Strikeout rate: strikeouts divided by plate appearances. | Walk rate: walks divided by plate appearances. | Batting average on balls in play: hits other than home runs, divided by at-bats that ended with the ball in play. |
|---|---|---|---|---|---|---|---|---|---|---|---|---|---|---|---|---|---|---|---|---|---|
| 2023 | Los Angeles Angels | 23 | 17 | 40 | 5 | 0 | 0 | 0 | 1 | 1 | 0 | 16 | 1 | .128 | .125 | .128 | .253 | .000 | 40.0% | 0.0% | .208 |
| 2024 | Los Angeles Angels | 24 | 11 | 38 | 8 | 0 | 0 | 1 | 4 | 4 | 3 | 12 | 2 | .229 | .289 | .314 | .603 | .085 | 31.6% | 7.9% | .318 |
| 2025 | Baltimore Orioles | 25 | 10 | 5 | 0 | 0 | 0 | 0 | 1 | 0 | 0 | 2 | 0 | .000 | .000 | .000 | .000 | .000 | 40.0% | 0.0% | .000 |
Posts about him
None yet.
Stats from the MLB Stats API, through Oct 9, 2026.