
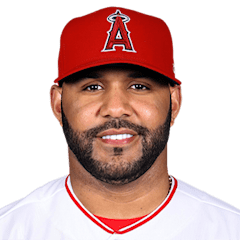
Jonathan Villar
2B · Last on a Brewers farm club: Colorado Springs Sky Sox, 2018
- B/T
- S/R
- Size
- 6' 0", 233 lb
- Born
- 1991-05-02 · La Vega, Dominican Republic
- Acquired
- —
- MLB debut
- 2013-07-22
The path and tables below cover his minor-league seasons with any club, as the MLB Stats API lists them, through 2026. His major-league seasons are in the "Major leagues" section.
Level path
- ROK2008DSL Phillies
- ROK2009GCL Phillies
- SS-A2009Williamsport Crosscutters
- A2010Lakewood BlueClaws
- A+2010Lancaster JetHawks
- A+2011Lancaster JetHawks
- AA2011Corpus Christi Hooks
- AA2012Corpus Christi Hooks
- AAA2013Oklahoma City RedHawks
- AAA2014Oklahoma City RedHawks
- AAA2015Fresno Grizzlies
- A2017Wisconsin Timber Rattlers
- AAA2018Colorado Springs Sky Sox
- AAA2021Syracuse Mets
- AAA2022Tacoma Rainiers
Hitting
| Year | Lvl | Club | Age | Games played. | Plate appearances: every trip to the plate, walks and hit-by-pitches included. | Hits. | Doubles. | Triples. | Home runs. | Runs scored. | Runs batted in. | Walks. | Strikeouts. | Stolen bases. | Batting average: hits divided by at-bats. | On-base percentage: how often he reaches base by a hit, walk or hit-by-pitch. | Slugging percentage: total bases divided by at-bats. | On-base plus slugging: OBP and SLG added together. | Isolated power: SLG minus AVG. It counts only the extra bases. | Strikeout rate: strikeouts divided by plate appearances. | Walk rate: walks divided by plate appearances. | Batting average on balls in play: hits other than home runs, divided by at-bats that ended with the ball in play. |
|---|---|---|---|---|---|---|---|---|---|---|---|---|---|---|---|---|---|---|---|---|---|---|
| 2008 | ROK | DSL Phillies | 17 | 62 | 255 | 58 | 6 | 3 | 1 | 37 | 21 | 30 | 56 | 27 | .271 | .367 | .341 | .708 | .070 | 22.0% | 11.8% | .356 |
| 2009 | ROK | GCL Phillies | 18 | 31 | 111 | 26 | 7 | 1 | 0 | 14 | 14 | 13 | 24 | 11 | .277 | .364 | .372 | .736 | .095 | 21.6% | 11.7% | .361 |
| 2009 | SS-A | Williamsport Crosscutters | 18 | 11 | 44 | 9 | 1 | 1 | 0 | 6 | 5 | 4 | 14 | 6 | .231 | .302 | .308 | .610 | .077 | 31.8% | 9.1% | .360 |
| 2010 | A | Lakewood BlueClaws | 19 | 100 | 420 | 101 | 18 | 4 | 2 | 61 | 36 | 26 | 103 | 38 | .272 | .332 | .358 | .690 | .086 | 24.5% | 6.2% | .369 |
| 2010 | A+ | Lancaster JetHawks | 19 | 32 | 143 | 29 | 6 | 2 | 3 | 18 | 19 | 12 | 50 | 7 | .225 | .294 | .372 | .666 | .147 | 35.0% | 8.4% | .338 |
| 2011 | A+ | Lancaster JetHawks | 20 | 47 | 207 | 45 | 7 | 4 | 4 | 26 | 26 | 25 | 56 | 20 | .259 | .353 | .414 | .767 | .155 | 27.1% | 12.1% | .350 |
| 2011 | AA | Corpus Christi Hooks | 20 | 83 | 367 | 75 | 16 | 2 | 10 | 52 | 26 | 29 | 100 | 14 | .231 | .301 | .386 | .687 | .155 | 27.2% | 7.9% | .301 |
| 2012 | AA | Corpus Christi Hooks | 21 | 86 | 377 | 85 | 7 | 2 | 11 | 54 | 50 | 35 | 87 | 39 | .261 | .336 | .396 | .732 | .135 | 23.1% | 9.3% | .319 |
| 2013 | AAA | Oklahoma City RedHawks | 22 | 91 | 386 | 94 | 16 | 8 | 8 | 47 | 41 | 32 | 93 | 31 | .277 | .341 | .442 | .783 | .165 | 24.1% | 8.3% | .358 |
| 2014 | AAA | Oklahoma City RedHawks | 23 | 51 | 225 | 49 | 2 | 3 | 3 | 34 | 27 | 31 | 61 | 24 | .258 | .363 | .347 | .710 | .089 | 27.1% | 13.8% | .362 |
| 2015 | AAA | Fresno Grizzlies | 24 | 70 | 313 | 76 | 13 | 5 | 5 | 59 | 32 | 27 | 77 | 35 | .271 | .342 | .407 | .749 | .136 | 24.6% | 8.6% | .359 |
| 2017 | A | Wisconsin Timber Rattlers | 26 | 4 | 15 | 8 | 1 | 1 | 0 | 2 | 6 | 1 | 3 | 0 | .615 | .600 | .846 | 1.446 | .231 | 20.0% | 6.7% | .727 |
| 2018 | AAA | Colorado Springs Sky Sox | 27 | 3 | 11 | 6 | 0 | 0 | 1 | 4 | 1 | 1 | 1 | 1 | .600 | .636 | .900 | 1.536 | .300 | 9.1% | 9.1% | .625 |
| 2021 | AAA | Syracuse Mets | 30 | 2 | 7 | 0 | 0 | 0 | 0 | 1 | 0 | 1 | 1 | 0 | .000 | .143 | .000 | .143 | .000 | 14.3% | 14.3% | .000 |
| 2022 | AAA | Tacoma Rainiers | 31 | 37 | 155 | 41 | 9 | 2 | 6 | 20 | 24 | 10 | 34 | 10 | .283 | .329 | .497 | .826 | .214 | 21.9% | 6.5% | .333 |
OPS by game
No 2026 game log on record, so there is no chart.
Major leagues
Hitting
| Year | Club | Age | Games played. | Plate appearances: every trip to the plate, walks and hit-by-pitches included. | Hits. | Doubles. | Triples. | Home runs. | Runs scored. | Runs batted in. | Walks. | Strikeouts. | Stolen bases. | Batting average: hits divided by at-bats. | On-base percentage: how often he reaches base by a hit, walk or hit-by-pitch. | Slugging percentage: total bases divided by at-bats. | On-base plus slugging: OBP and SLG added together. | Isolated power: SLG minus AVG. It counts only the extra bases. | Strikeout rate: strikeouts divided by plate appearances. | Walk rate: walks divided by plate appearances. | Batting average on balls in play: hits other than home runs, divided by at-bats that ended with the ball in play. |
|---|---|---|---|---|---|---|---|---|---|---|---|---|---|---|---|---|---|---|---|---|---|
| 2013 | Houston Astros | 22 | 58 | 241 | 51 | 9 | 2 | 1 | 26 | 8 | 24 | 71 | 18 | .243 | .321 | .319 | .640 | .076 | 29.5% | 10.0% | .362 |
| 2014 | Houston Astros | 23 | 87 | 289 | 55 | 13 | 2 | 7 | 31 | 27 | 19 | 80 | 17 | .209 | .267 | .354 | .621 | .145 | 27.7% | 6.6% | .271 |
| 2015 | Houston Astros | 24 | 53 | 128 | 33 | 7 | 1 | 2 | 18 | 11 | 10 | 29 | 7 | .284 | .339 | .414 | .753 | .130 | 22.7% | 7.8% | .360 |
| 2016 | Milwaukee Brewers | 25 | 156 | 679 | 168 | 38 | 3 | 19 | 92 | 63 | 79 | 174 | 62 | .285 | .369 | .457 | .826 | .172 | 25.6% | 11.6% | .373 |
| 2017 | Milwaukee Brewers | 26 | 122 | 436 | 97 | 18 | 1 | 11 | 49 | 40 | 30 | 132 | 23 | .241 | .293 | .372 | .665 | .131 | 30.3% | 6.9% | .330 |
| 2018 | Milwaukee Brewers | 27 | 87 | 279 | 67 | 10 | 1 | 6 | 26 | 22 | 19 | 80 | 14 | .261 | .315 | .377 | .692 | .116 | 28.7% | 6.8% | .355 |
| 2018 | Baltimore Orioles | 27 | 54 | 236 | 54 | 4 | 0 | 8 | 28 | 24 | 22 | 58 | 21 | .258 | .336 | .392 | .728 | .134 | 24.6% | 9.3% | .319 |
| 2018 | 2 teams | 27 | 141 | 515 | 121 | 14 | 1 | 14 | 54 | 46 | 41 | 138 | 35 | .260 | .325 | .384 | .709 | .124 | 26.8% | 8.0% | .339 |
| 2019 | Baltimore Orioles | 28 | 162 | 714 | 176 | 33 | 5 | 24 | 111 | 73 | 61 | 176 | 40 | .274 | .339 | .453 | .792 | .179 | 24.6% | 8.5% | .341 |
| 2020 | Miami Marlins | 29 | 30 | 128 | 30 | 4 | 0 | 2 | 10 | 9 | 10 | 32 | 9 | .259 | .315 | .345 | .660 | .086 | 25.0% | 7.8% | .337 |
| 2020 | Toronto Blue Jays | 29 | 22 | 79 | 13 | 1 | 0 | 0 | 3 | 6 | 9 | 22 | 7 | .188 | .278 | .203 | .481 | .015 | 27.8% | 11.4% | .271 |
| 2020 | 2 teams | 29 | 52 | 207 | 43 | 5 | 0 | 2 | 13 | 15 | 19 | 54 | 16 | .232 | .301 | .292 | .593 | .060 | 26.1% | 9.2% | .313 |
| 2021 | New York Mets | 30 | 142 | 505 | 113 | 18 | 2 | 18 | 63 | 42 | 46 | 132 | 14 | .249 | .322 | .416 | .738 | .167 | 26.1% | 9.1% | .313 |
| 2022 | Chicago Cubs | 31 | 46 | 166 | 34 | 6 | 2 | 2 | 19 | 15 | 11 | 42 | 6 | .222 | .271 | .327 | .598 | .105 | 25.3% | 6.6% | .288 |
| 2022 | Los Angeles Angels | 31 | 13 | 54 | 8 | 0 | 0 | 1 | 6 | 3 | 4 | 17 | 1 | .163 | .226 | .224 | .450 | .061 | 31.5% | 7.4% | .226 |
| 2022 | 2 teams | 31 | 59 | 220 | 42 | 6 | 2 | 3 | 25 | 18 | 15 | 59 | 7 | .208 | .260 | .302 | .562 | .094 | 26.8% | 6.8% | .275 |
Posts about him
None yet.
Stats from the MLB Stats API, through Oct 9, 2026.