
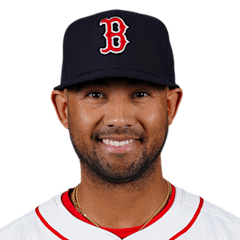
Jamie Westbrook
2B · Last on a Brewers farm club: Nashville Sounds, 2022
- B/T
- R/R
- Size
- 5' 7", 193 lb
- Born
- 1995-06-18 · Springfield, MA, USA
- Acquired
- Drafted 2013, round 5, pick 150, by Arizona Diamondbacks
- MLB debut
- 2024-06-02
The path and tables below cover his minor-league seasons with any club, as the MLB Stats API lists them, through 2026. His major-league seasons are in the "Major leagues" section.
Level path
- ROK2013ACL D-backs
- ROK2013Missoula Osprey
- ROK2013
- A2014South Bend Silver Hawks
- A+2015Visalia Rawhide
- AA2016Mobile BayBears
- ROK2017ACL D-backs
- AA2017Jackson Generals
- AA2018Jackson Generals
- AAA2018Reno Aces
- AA2019Jackson Generals
- AAA2019Reno Aces
- AA2021Biloxi Shuckers
- AAA2021Nashville Sounds
- AAA2022Nashville Sounds
- AAA2022Toledo Mud Hens
- AAA2022
- AAA2023Scranton/Wilkes-Barre RailRiders
- AAA2024Worcester Red Sox
- AAA2025Durham Bulls
Hitting
| Year | Lvl | Club | Age | Games played. | Plate appearances: every trip to the plate, walks and hit-by-pitches included. | Hits. | Doubles. | Triples. | Home runs. | Runs scored. | Runs batted in. | Walks. | Strikeouts. | Stolen bases. | Batting average: hits divided by at-bats. | On-base percentage: how often he reaches base by a hit, walk or hit-by-pitch. | Slugging percentage: total bases divided by at-bats. | On-base plus slugging: OBP and SLG added together. | Isolated power: SLG minus AVG. It counts only the extra bases. | Strikeout rate: strikeouts divided by plate appearances. | Walk rate: walks divided by plate appearances. | Batting average on balls in play: hits other than home runs, divided by at-bats that ended with the ball in play. |
|---|---|---|---|---|---|---|---|---|---|---|---|---|---|---|---|---|---|---|---|---|---|---|
| 2013 | ROK | ACL D-backs | 18 | 40 | 179 | 45 | 8 | 8 | 1 | 31 | 20 | 17 | 21 | 3 | .292 | .373 | .468 | .841 | .176 | 11.7% | 9.5% | .328 |
| 2013 | ROK | Missoula Osprey | 18 | 17 | 73 | 17 | 3 | 0 | 1 | 12 | 13 | 6 | 20 | 1 | .254 | .315 | .343 | .658 | .089 | 27.4% | 8.2% | .348 |
| 2013 | ROK | — | 18 | 57 | 252 | 62 | 11 | 8 | 2 | 43 | 33 | 23 | 41 | 4 | .281 | .356 | .430 | .786 | .149 | 16.3% | 9.1% | .333 |
| 2014 | A | South Bend Silver Hawks | 19 | 131 | 565 | 132 | 27 | 4 | 8 | 69 | 49 | 38 | 98 | 6 | .259 | .314 | .375 | .689 | .116 | 17.3% | 6.7% | .303 |
| 2015 | A+ | Visalia Rawhide | 20 | 123 | 527 | 153 | 33 | 4 | 17 | 75 | 72 | 24 | 69 | 14 | .319 | .357 | .510 | .867 | .191 | 13.1% | 4.6% | .337 |
| 2016 | AA | Mobile BayBears | 21 | 122 | 473 | 114 | 21 | 1 | 5 | 50 | 36 | 26 | 60 | 10 | .262 | .312 | .349 | .661 | .087 | 12.7% | 5.5% | .294 |
| 2017 | ROK | ACL D-backs | 22 | 2 | 7 | 2 | 0 | 0 | 1 | 1 | 1 | 0 | 0 | 0 | .286 | .286 | .714 | 1.000 | .428 | 0.0% | 0.0% | .167 |
| 2017 | AA | Jackson Generals | 22 | 104 | 409 | 100 | 19 | 3 | 8 | 38 | 55 | 16 | 43 | 2 | .265 | .305 | .395 | .700 | .130 | 10.5% | 3.9% | .278 |
| 2018 | AA | Jackson Generals | 23 | 107 | 443 | 117 | 20 | 5 | 15 | 65 | 68 | 24 | 71 | 4 | .287 | .336 | .471 | .807 | .184 | 16.0% | 5.4% | .315 |
| 2018 | AAA | Reno Aces | 23 | 7 | 25 | 9 | 1 | 0 | 4 | 6 | 6 | 2 | 2 | 0 | .391 | .440 | .957 | 1.397 | .566 | 8.0% | 8.0% | .294 |
| 2019 | AA | Jackson Generals | 24 | 98 | 388 | 92 | 20 | 1 | 13 | 51 | 59 | 32 | 68 | 1 | .269 | .340 | .447 | .787 | .178 | 17.5% | 8.2% | .296 |
| 2019 | AAA | Reno Aces | 24 | 30 | 127 | 34 | 6 | 0 | 3 | 25 | 18 | 16 | 15 | 0 | .321 | .413 | .462 | .875 | .141 | 11.8% | 12.6% | .344 |
| 2021 | AA | Biloxi Shuckers | 26 | 19 | 82 | 18 | 1 | 1 | 1 | 12 | 7 | 9 | 12 | 1 | .261 | .354 | .348 | .702 | .087 | 14.6% | 11.0% | .293 |
| 2021 | AAA | Nashville Sounds | 26 | 70 | 287 | 72 | 15 | 1 | 11 | 45 | 47 | 21 | 42 | 2 | .287 | .353 | .486 | .839 | .199 | 14.6% | 7.3% | .302 |
| 2022 | AAA | Nashville Sounds | 27 | 3 | 12 | 5 | 1 | 0 | 0 | 3 | 0 | 1 | 0 | 0 | .500 | .545 | .600 | 1.145 | .100 | 0.0% | 8.3% | .500 |
| 2022 | AAA | Toledo Mud Hens | 27 | 120 | 499 | 104 | 21 | 0 | 11 | 55 | 48 | 53 | 80 | 1 | .248 | .349 | .377 | .726 | .129 | 16.0% | 10.6% | .280 |
| 2022 | AAA | — | 27 | 123 | 511 | 109 | 22 | 0 | 11 | 58 | 48 | 54 | 80 | 1 | .254 | .353 | .382 | .735 | .128 | 15.7% | 10.6% | .287 |
| 2023 | AAA | Scranton/Wilkes-Barre RailRiders | 28 | 117 | 496 | 121 | 20 | 0 | 21 | 70 | 65 | 67 | 81 | 6 | .294 | .400 | .496 | .896 | .202 | 16.3% | 13.5% | .322 |
| 2024 | AAA | Worcester Red Sox | 29 | 102 | 425 | 99 | 24 | 1 | 12 | 52 | 71 | 48 | 72 | 2 | .277 | .369 | .450 | .819 | .173 | 16.9% | 11.3% | .311 |
| 2025 | AAA | Durham Bulls | 30 | 116 | 430 | 99 | 29 | 0 | 7 | 47 | 49 | 43 | 70 | 2 | .266 | .350 | .401 | .751 | .135 | 16.3% | 10.0% | .307 |
OPS by game
No 2026 game log on record, so there is no chart.
Major leagues
Hitting
| Year | Club | Age | Games played. | Plate appearances: every trip to the plate, walks and hit-by-pitches included. | Hits. | Doubles. | Triples. | Home runs. | Runs scored. | Runs batted in. | Walks. | Strikeouts. | Stolen bases. | Batting average: hits divided by at-bats. | On-base percentage: how often he reaches base by a hit, walk or hit-by-pitch. | Slugging percentage: total bases divided by at-bats. | On-base plus slugging: OBP and SLG added together. | Isolated power: SLG minus AVG. It counts only the extra bases. | Strikeout rate: strikeouts divided by plate appearances. | Walk rate: walks divided by plate appearances. | Batting average on balls in play: hits other than home runs, divided by at-bats that ended with the ball in play. |
|---|---|---|---|---|---|---|---|---|---|---|---|---|---|---|---|---|---|---|---|---|---|
| 2024 | Boston Red Sox | 29 | 21 | 48 | 6 | 2 | 0 | 2 | 4 | 7 | 4 | 14 | 0 | .150 | .234 | .350 | .584 | .200 | 29.2% | 8.3% | .154 |
Posts about him
None yet.
Stats from the MLB Stats API, through Oct 9, 2026.