
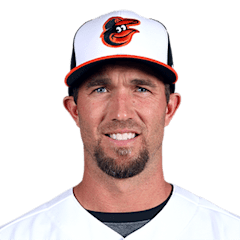
J.J. Hardy
SS · Last on a Brewers farm club: Nashville Sounds, 2009
- B/T
- R/R
- Size
- 6' 1", 200 lb
- Born
- 1982-08-19 · Tucson, AZ, USA
- Acquired
- Drafted 2001, round 2, pick 56, by Milwaukee Brewers
- MLB debut
- 2005-04-04
The path and tables below cover his minor-league seasons with any club, as the MLB Stats API lists them, through 2026. His major-league seasons are in the "Major leagues" section.
Level path
- ROK2001AZL Brewers
- ROK2001Ogden Raptors
- ROK2001
- A+2002High Desert Mavericks
- AA2002Huntsville Stars
- AA2003Huntsville Stars
- AAA2004Indianapolis Indians
- AAA2009Nashville Sounds
- A2010Beloit Snappers
- AAA2011Norfolk Tides
- AA2015Bowie Baysox
- AA2016Bowie Baysox
- AAA2017Norfolk Tides
Hitting
| Year | Lvl | Club | Age | Games played. | Plate appearances: every trip to the plate, walks and hit-by-pitches included. | Hits. | Doubles. | Triples. | Home runs. | Runs scored. | Runs batted in. | Walks. | Strikeouts. | Stolen bases. | Batting average: hits divided by at-bats. | On-base percentage: how often he reaches base by a hit, walk or hit-by-pitch. | Slugging percentage: total bases divided by at-bats. | On-base plus slugging: OBP and SLG added together. | Isolated power: SLG minus AVG. It counts only the extra bases. | Strikeout rate: strikeouts divided by plate appearances. | Walk rate: walks divided by plate appearances. | Batting average on balls in play: hits other than home runs, divided by at-bats that ended with the ball in play. |
|---|---|---|---|---|---|---|---|---|---|---|---|---|---|---|---|---|---|---|---|---|---|---|
| 2001 | ROK | AZL Brewers | 18 | 5 | 22 | 5 | 2 | 1 | 0 | 6 | 1 | 1 | 2 | 0 | .250 | .286 | .450 | .736 | .200 | 9.1% | 4.5% | .278 |
| 2001 | ROK | Ogden Raptors | 18 | 35 | 144 | 31 | 5 | 0 | 2 | 20 | 15 | 15 | 12 | 1 | .248 | .326 | .336 | .662 | .088 | 8.3% | 10.4% | .259 |
| 2001 | ROK | — | 18 | 40 | 166 | 36 | 7 | 1 | 2 | 26 | 16 | 16 | 14 | 1 | .248 | .321 | .352 | .673 | .104 | 8.4% | 9.6% | .262 |
| 2002 | A+ | High Desert Mavericks | 19 | 84 | 364 | 98 | 19 | 1 | 6 | 53 | 48 | 19 | 38 | 9 | .293 | .327 | .409 | .736 | .116 | 10.4% | 5.2% | .310 |
| 2002 | AA | Huntsville Stars | 19 | 38 | 160 | 33 | 7 | 0 | 1 | 14 | 13 | 9 | 19 | 1 | .228 | .269 | .297 | .566 | .069 | 11.9% | 5.6% | .252 |
| 2003 | AA | Huntsville Stars | 20 | 114 | 485 | 116 | 26 | 0 | 12 | 67 | 62 | 58 | 54 | 6 | .279 | .368 | .428 | .796 | .149 | 11.1% | 12.0% | .294 |
| 2004 | AAA | Indianapolis Indians | 21 | 26 | 112 | 28 | 10 | 0 | 4 | 17 | 20 | 9 | 8 | 0 | .277 | .330 | .495 | .825 | .218 | 7.1% | 8.0% | .264 |
| 2009 | AAA | Nashville Sounds | 26 | 18 | 74 | 18 | 2 | 0 | 4 | 7 | 12 | 3 | 9 | 0 | .254 | .284 | .451 | .735 | .197 | 12.2% | 4.1% | .241 |
| 2010 | A | Beloit Snappers | 27 | 3 | 12 | 2 | 0 | 0 | 0 | 0 | 0 | 1 | 2 | 0 | .200 | .333 | .200 | .533 | .000 | 16.7% | 8.3% | .250 |
| 2011 | AAA | Norfolk Tides | 28 | 3 | 12 | 2 | 0 | 0 | 0 | 2 | 0 | 3 | 1 | 0 | .222 | .417 | .222 | .639 | .000 | 8.3% | 25.0% | .250 |
| 2015 | AA | Bowie Baysox | 32 | 3 | 12 | 4 | 1 | 0 | 0 | 2 | 1 | 0 | 2 | 0 | .333 | .333 | .417 | .750 | .084 | 16.7% | 0.0% | .400 |
| 2016 | AA | Bowie Baysox | 33 | 3 | 12 | 4 | 0 | 0 | 0 | 1 | 0 | 1 | 1 | 0 | .364 | .417 | .364 | .781 | .000 | 8.3% | 8.3% | .400 |
| 2017 | AAA | Norfolk Tides | 34 | 9 | 31 | 5 | 1 | 0 | 1 | 6 | 3 | 9 | 7 | 0 | .227 | .452 | .409 | .861 | .182 | 22.6% | 29.0% | .286 |
OPS by game
No 2026 game log on record, so there is no chart.
Major leagues
Hitting
| Year | Club | Age | Games played. | Plate appearances: every trip to the plate, walks and hit-by-pitches included. | Hits. | Doubles. | Triples. | Home runs. | Runs scored. | Runs batted in. | Walks. | Strikeouts. | Stolen bases. | Batting average: hits divided by at-bats. | On-base percentage: how often he reaches base by a hit, walk or hit-by-pitch. | Slugging percentage: total bases divided by at-bats. | On-base plus slugging: OBP and SLG added together. | Isolated power: SLG minus AVG. It counts only the extra bases. | Strikeout rate: strikeouts divided by plate appearances. | Walk rate: walks divided by plate appearances. | Batting average on balls in play: hits other than home runs, divided by at-bats that ended with the ball in play. |
|---|---|---|---|---|---|---|---|---|---|---|---|---|---|---|---|---|---|---|---|---|---|
| 2005 | Milwaukee Brewers | 22 | 124 | 427 | 92 | 22 | 1 | 9 | 46 | 50 | 44 | 48 | 0 | .247 | .327 | .384 | .711 | .137 | 11.2% | 10.3% | .262 |
| 2006 | Milwaukee Brewers | 23 | 35 | 139 | 31 | 5 | 0 | 5 | 13 | 14 | 10 | 23 | 1 | .242 | .295 | .398 | .693 | .156 | 16.5% | 7.2% | .257 |
| 2007 | Milwaukee Brewers | 24 | 151 | 638 | 164 | 30 | 1 | 26 | 89 | 80 | 40 | 73 | 2 | .277 | .323 | .463 | .786 | .186 | 11.4% | 6.3% | .279 |
| 2008 | Milwaukee Brewers | 25 | 146 | 629 | 161 | 31 | 4 | 24 | 78 | 74 | 52 | 98 | 2 | .283 | .343 | .478 | .821 | .195 | 15.6% | 8.3% | .305 |
| 2009 | Milwaukee Brewers | 26 | 115 | 465 | 95 | 16 | 2 | 11 | 53 | 47 | 43 | 85 | 0 | .229 | .302 | .357 | .659 | .128 | 18.3% | 9.2% | .260 |
| 2010 | Minnesota Twins | 27 | 101 | 375 | 91 | 19 | 3 | 6 | 44 | 38 | 28 | 54 | 1 | .268 | .320 | .394 | .714 | .126 | 14.4% | 7.5% | .299 |
| 2011 | Baltimore Orioles | 28 | 129 | 567 | 142 | 27 | 0 | 30 | 76 | 80 | 31 | 92 | 0 | .269 | .310 | .491 | .801 | .222 | 16.2% | 5.5% | .273 |
| 2012 | Baltimore Orioles | 29 | 158 | 713 | 158 | 30 | 2 | 22 | 85 | 68 | 38 | 106 | 0 | .238 | .282 | .389 | .671 | .151 | 14.9% | 5.3% | .253 |
| 2013 | Baltimore Orioles | 30 | 159 | 644 | 158 | 27 | 0 | 25 | 66 | 76 | 38 | 73 | 2 | .263 | .306 | .433 | .739 | .170 | 11.3% | 5.9% | .263 |
| 2014 | Baltimore Orioles | 31 | 141 | 569 | 142 | 28 | 0 | 9 | 56 | 52 | 29 | 104 | 0 | .268 | .309 | .372 | .681 | .104 | 18.3% | 5.1% | .317 |
| 2015 | Baltimore Orioles | 32 | 114 | 437 | 90 | 14 | 0 | 8 | 45 | 37 | 20 | 88 | 0 | .219 | .253 | .311 | .564 | .092 | 20.1% | 4.6% | .257 |
| 2016 | Baltimore Orioles | 33 | 115 | 438 | 109 | 29 | 0 | 9 | 43 | 48 | 26 | 68 | 0 | .269 | .309 | .407 | .716 | .138 | 15.5% | 5.9% | .299 |
| 2017 | Baltimore Orioles | 34 | 73 | 268 | 55 | 13 | 1 | 4 | 24 | 24 | 12 | 48 | 0 | .217 | .255 | .323 | .578 | .106 | 17.9% | 4.5% | .252 |
Posts about him
None yet.
Stats from the MLB Stats API, through Oct 9, 2026.