
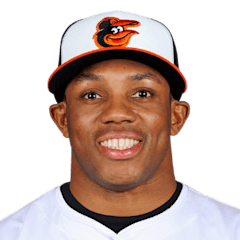
Greg Allen
CF · Last on a Brewers farm club: Nashville Sounds, 2023
- B/T
- S/R
- Size
- 5' 10", 187 lb
- Born
- 1993-03-15 · San Diego, CA, USA
- Acquired
- Drafted 2014, round 6, pick 188, by Cleveland Indians
- MLB debut
- 2017-09-01
The path and tables below cover his minor-league seasons with any club, as the MLB Stats API lists them, through 2026. His major-league seasons are in the "Major leagues" section.
Level path
- SS-A2014Mahoning Valley Scrappers
- A2015Lake County Captains
- A+2015Lynchburg Hillcats
- A+2016Lynchburg Hillcats
- AA2016Akron RubberDucks
- ROK2017AZL Indians
- AA2017Akron RubberDucks
- AAA2018Columbus Clippers
- AAA2019Columbus Clippers
- AAA2021Scranton/Wilkes-Barre RailRiders
- A2022Bradenton Marauders
- AAA2022Indianapolis Indians
- A2023Tampa Tarpons
- AAA2023Worcester Red Sox
- AAA2023Scranton/Wilkes-Barre RailRiders
- AAA2023Nashville Sounds
- AAA2023
- AA2024Somerset Patriots
- AAA2024Scranton/Wilkes-Barre RailRiders
- AAA2025Iowa Cubs
Hitting
| Year | Lvl | Club | Age | Games played. | Plate appearances: every trip to the plate, walks and hit-by-pitches included. | Hits. | Doubles. | Triples. | Home runs. | Runs scored. | Runs batted in. | Walks. | Strikeouts. | Stolen bases. | Batting average: hits divided by at-bats. | On-base percentage: how often he reaches base by a hit, walk or hit-by-pitch. | Slugging percentage: total bases divided by at-bats. | On-base plus slugging: OBP and SLG added together. | Isolated power: SLG minus AVG. It counts only the extra bases. | Strikeout rate: strikeouts divided by plate appearances. | Walk rate: walks divided by plate appearances. | Batting average on balls in play: hits other than home runs, divided by at-bats that ended with the ball in play. |
|---|---|---|---|---|---|---|---|---|---|---|---|---|---|---|---|---|---|---|---|---|---|---|
| 2014 | SS-A | Mahoning Valley Scrappers | 21 | 57 | 270 | 55 | 8 | 2 | 0 | 46 | 19 | 27 | 26 | 30 | .244 | .361 | .298 | .659 | .054 | 9.6% | 10.0% | .274 |
| 2015 | A | Lake County Captains | 22 | 123 | 564 | 131 | 27 | 2 | 7 | 83 | 45 | 53 | 57 | 43 | .273 | .368 | .382 | .750 | .109 | 10.1% | 9.4% | .297 |
| 2015 | A+ | Lynchburg Hillcats | 22 | 3 | 16 | 2 | 1 | 0 | 0 | 2 | 0 | 2 | 3 | 3 | .154 | .313 | .231 | .544 | .077 | 18.8% | 12.5% | .200 |
| 2016 | A+ | Lynchburg Hillcats | 23 | 92 | 432 | 103 | 16 | 4 | 4 | 93 | 31 | 58 | 51 | 38 | .298 | .424 | .402 | .826 | .104 | 11.8% | 13.4% | .338 |
| 2016 | AA | Akron RubberDucks | 23 | 37 | 174 | 42 | 7 | 3 | 3 | 26 | 13 | 19 | 27 | 7 | .290 | .399 | .441 | .840 | .151 | 15.5% | 10.9% | .336 |
| 2017 | ROK | AZL Indians | 24 | 5 | 17 | 5 | 0 | 0 | 0 | 3 | 2 | 0 | 1 | 3 | .333 | .353 | .333 | .686 | .000 | 5.9% | 0.0% | .333 |
| 2017 | AA | Akron RubberDucks | 24 | 71 | 303 | 68 | 16 | 1 | 2 | 37 | 24 | 22 | 55 | 21 | .264 | .344 | .357 | .701 | .093 | 18.2% | 7.3% | .319 |
| 2018 | AAA | Columbus Clippers | 25 | 47 | 205 | 51 | 13 | 0 | 2 | 31 | 14 | 19 | 44 | 12 | .298 | .395 | .409 | .804 | .111 | 21.5% | 9.3% | .389 |
| 2019 | AAA | Columbus Clippers | 26 | 48 | 226 | 53 | 9 | 3 | 5 | 37 | 17 | 20 | 44 | 10 | .268 | .358 | .419 | .777 | .151 | 19.5% | 8.8% | .322 |
| 2021 | AAA | Scranton/Wilkes-Barre RailRiders | 28 | 73 | 263 | 70 | 13 | 1 | 5 | 49 | 28 | 26 | 45 | 26 | .326 | .442 | .465 | .907 | .139 | 17.1% | 9.9% | .394 |
| 2022 | A | Bradenton Marauders | 29 | 3 | 11 | 3 | 0 | 0 | 0 | 1 | 0 | 1 | 3 | 0 | .333 | .455 | .333 | .788 | .000 | 27.3% | 9.1% | .500 |
| 2022 | AAA | Indianapolis Indians | 29 | 4 | 16 | 6 | 2 | 0 | 1 | 4 | 3 | 0 | 3 | 0 | .429 | .500 | .786 | 1.286 | .357 | 18.8% | 0.0% | .500 |
| 2023 | A | Tampa Tarpons | 30 | 2 | 7 | 3 | 0 | 0 | 0 | 4 | 0 | 1 | 1 | 2 | .500 | .571 | .500 | 1.071 | .000 | 14.3% | 14.3% | .600 |
| 2023 | AAA | Worcester Red Sox | 30 | 37 | 151 | 29 | 8 | 1 | 2 | 25 | 15 | 21 | 29 | 23 | .250 | .407 | .388 | .795 | .138 | 19.2% | 13.9% | .310 |
| 2023 | AAA | Scranton/Wilkes-Barre RailRiders | 30 | 4 | 15 | 3 | 0 | 0 | 1 | 3 | 3 | 1 | 3 | 0 | .231 | .333 | .462 | .795 | .231 | 20.0% | 6.7% | .222 |
| 2023 | AAA | Nashville Sounds | 30 | 8 | 37 | 7 | 1 | 0 | 0 | 4 | 1 | 3 | 7 | 3 | .219 | .297 | .250 | .547 | .031 | 18.9% | 8.1% | .269 |
| 2023 | AAA | — | 30 | 49 | 203 | 39 | 9 | 1 | 3 | 32 | 19 | 25 | 39 | 26 | .242 | .381 | .366 | .747 | .124 | 19.2% | 12.3% | .295 |
| 2024 | AA | Somerset Patriots | 31 | 3 | 11 | 2 | 0 | 0 | 0 | 0 | 0 | 1 | 3 | 0 | .200 | .273 | .200 | .473 | .000 | 27.3% | 9.1% | .286 |
| 2024 | AAA | Scranton/Wilkes-Barre RailRiders | 31 | 58 | 218 | 40 | 9 | 3 | 3 | 29 | 22 | 23 | 47 | 13 | .225 | .338 | .360 | .698 | .135 | 21.6% | 10.6% | .282 |
| 2025 | AAA | Iowa Cubs | 32 | 61 | 231 | 54 | 14 | 1 | 6 | 31 | 32 | 15 | 52 | 11 | .270 | .355 | .440 | .795 | .170 | 22.5% | 6.5% | .336 |
OPS by game
No 2026 game log on record, so there is no chart.
Major leagues
Hitting
| Year | Club | Age | Games played. | Plate appearances: every trip to the plate, walks and hit-by-pitches included. | Hits. | Doubles. | Triples. | Home runs. | Runs scored. | Runs batted in. | Walks. | Strikeouts. | Stolen bases. | Batting average: hits divided by at-bats. | On-base percentage: how often he reaches base by a hit, walk or hit-by-pitch. | Slugging percentage: total bases divided by at-bats. | On-base plus slugging: OBP and SLG added together. | Isolated power: SLG minus AVG. It counts only the extra bases. | Strikeout rate: strikeouts divided by plate appearances. | Walk rate: walks divided by plate appearances. | Batting average on balls in play: hits other than home runs, divided by at-bats that ended with the ball in play. |
|---|---|---|---|---|---|---|---|---|---|---|---|---|---|---|---|---|---|---|---|---|---|
| 2017 | Cleveland Indians | 24 | 25 | 39 | 8 | 1 | 0 | 1 | 7 | 6 | 2 | 8 | 1 | .229 | .282 | .343 | .625 | .114 | 20.5% | 5.1% | .259 |
| 2018 | Cleveland Indians | 25 | 91 | 291 | 68 | 11 | 3 | 2 | 36 | 20 | 14 | 58 | 21 | .257 | .310 | .343 | .653 | .086 | 19.9% | 4.8% | .320 |
| 2019 | Cleveland Indians | 26 | 89 | 256 | 53 | 9 | 3 | 4 | 30 | 27 | 11 | 53 | 8 | .229 | .290 | .346 | .636 | .117 | 20.7% | 4.3% | .280 |
| 2020 | Cleveland Indians | 27 | 15 | 28 | 4 | 1 | 0 | 1 | 3 | 4 | 1 | 9 | 1 | .160 | .214 | .320 | .534 | .160 | 32.1% | 3.6% | .188 |
| 2020 | San Diego Padres | 27 | 1 | 4 | 0 | 0 | 0 | 0 | 1 | 0 | 2 | 1 | 1 | .000 | .750 | .000 | .750 | .000 | 25.0% | 50.0% | — |
| 2020 | 2 teams | 27 | 16 | 32 | 4 | 1 | 0 | 1 | 4 | 4 | 3 | 10 | 2 | .154 | .281 | .308 | .589 | .154 | 31.3% | 9.4% | .188 |
| 2021 | New York Yankees | 28 | 15 | 48 | 10 | 4 | 1 | 0 | 9 | 2 | 5 | 13 | 5 | .270 | .417 | .432 | .849 | .162 | 27.1% | 10.4% | .400 |
| 2022 | Pittsburgh Pirates | 29 | 46 | 134 | 22 | 4 | 0 | 2 | 17 | 8 | 10 | 42 | 8 | .186 | .260 | .271 | .531 | .085 | 31.3% | 7.5% | .267 |
| 2023 | New York Yankees | 30 | 22 | 28 | 5 | 1 | 1 | 1 | 6 | 1 | 2 | 10 | 3 | .217 | .333 | .478 | .811 | .261 | 35.7% | 7.1% | .333 |
| 2025 | Baltimore Orioles | 32 | 7 | 14 | 0 | 0 | 0 | 0 | 1 | 0 | 0 | 5 | 0 | .000 | .000 | .000 | .000 | .000 | 35.7% | 0.0% | .000 |
Posts about him
None yet.
Stats from the MLB Stats API, through Oct 9, 2026.