
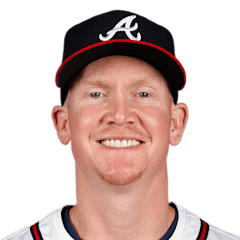
Garrett Cooper
1B · Last on a Brewers farm club: Colorado Springs Sky Sox, 2017
- B/T
- R/R
- Size
- 6' 4", 235 lb
- Born
- 1990-12-25 · Torrance, CA, USA
- Acquired
- Drafted 2013, round 6, pick 182, by Milwaukee Brewers
- MLB debut
- 2017-07-14
The path and tables below cover his minor-league seasons with any club, as the MLB Stats API lists them, through 2026. His major-league seasons are in the "Major leagues" section.
Level path
- ROK2013Helena Brewers
- A2013Wisconsin Timber Rattlers
- ROK2014AZL Brewers
- A2014Wisconsin Timber Rattlers
- A+2014Brevard County Manatees
- A+2015Brevard County Manatees
- AA2015Biloxi Shuckers
- AA2016Biloxi Shuckers
- AAA2016Colorado Springs Sky Sox
- AA2017Trenton Thunder
- AAA2017Colorado Springs Sky Sox
- AAA2017Scranton/Wilkes-Barre RailRiders
- AAA2017
- A+2018Jupiter Hammerheads
- AAA2018New Orleans Baby Cakes
- A+2019Jupiter Hammerheads
- AAA2021Jacksonville Jumbo Shrimp
- A2022Jupiter Hammerheads
- AAA2023Jacksonville Jumbo Shrimp
- AAA2024Norfolk Tides
- AAA2025Gwinnett Stripers
Hitting
| Year | Lvl | Club | Age | Games played. | Plate appearances: every trip to the plate, walks and hit-by-pitches included. | Hits. | Doubles. | Triples. | Home runs. | Runs scored. | Runs batted in. | Walks. | Strikeouts. | Stolen bases. | Batting average: hits divided by at-bats. | On-base percentage: how often he reaches base by a hit, walk or hit-by-pitch. | Slugging percentage: total bases divided by at-bats. | On-base plus slugging: OBP and SLG added together. | Isolated power: SLG minus AVG. It counts only the extra bases. | Strikeout rate: strikeouts divided by plate appearances. | Walk rate: walks divided by plate appearances. | Batting average on balls in play: hits other than home runs, divided by at-bats that ended with the ball in play. |
|---|---|---|---|---|---|---|---|---|---|---|---|---|---|---|---|---|---|---|---|---|---|---|
| 2013 | ROK | Helena Brewers | 22 | 16 | 70 | 17 | 4 | 0 | 4 | 11 | 10 | 7 | 18 | 0 | .274 | .357 | .532 | .889 | .258 | 25.7% | 10.0% | .325 |
| 2013 | A | Wisconsin Timber Rattlers | 22 | 32 | 133 | 35 | 6 | 3 | 2 | 15 | 20 | 10 | 33 | 0 | .287 | .346 | .434 | .780 | .147 | 24.8% | 7.5% | .379 |
| 2014 | ROK | AZL Brewers | 23 | 5 | 19 | 6 | 1 | 0 | 1 | 3 | 3 | 3 | 3 | 0 | .375 | .474 | .625 | 1.099 | .250 | 15.8% | 15.8% | .417 |
| 2014 | A | Wisconsin Timber Rattlers | 23 | 9 | 32 | 10 | 3 | 0 | 1 | 2 | 8 | 0 | 4 | 0 | .333 | .375 | .533 | .908 | .200 | 12.5% | 0.0% | .360 |
| 2014 | A+ | Brevard County Manatees | 23 | 53 | 188 | 39 | 11 | 0 | 2 | 23 | 16 | 18 | 51 | 1 | .238 | .330 | .341 | .671 | .103 | 27.1% | 9.6% | .330 |
| 2015 | A+ | Brevard County Manatees | 24 | 119 | 470 | 124 | 32 | 2 | 8 | 55 | 54 | 35 | 88 | 1 | .294 | .356 | .436 | .792 | .142 | 18.7% | 7.4% | .352 |
| 2015 | AA | Biloxi Shuckers | 24 | 9 | 36 | 16 | 2 | 1 | 0 | 3 | 5 | 7 | 2 | 0 | .552 | .639 | .690 | 1.329 | .138 | 5.6% | 19.4% | .593 |
| 2016 | AA | Biloxi Shuckers | 25 | 92 | 329 | 90 | 22 | 1 | 4 | 27 | 49 | 20 | 55 | 3 | .299 | .350 | .419 | .769 | .120 | 16.7% | 6.1% | .351 |
| 2016 | AAA | Colorado Springs Sky Sox | 25 | 36 | 139 | 35 | 5 | 0 | 5 | 17 | 20 | 10 | 20 | 0 | .276 | .331 | .433 | .764 | .157 | 14.4% | 7.2% | .291 |
| 2017 | AA | Trenton Thunder | 26 | 6 | 23 | 8 | 1 | 0 | 1 | 5 | 2 | 3 | 6 | 0 | .400 | .478 | .600 | 1.078 | .200 | 26.1% | 13.0% | .538 |
| 2017 | AAA | Colorado Springs Sky Sox | 26 | 75 | 320 | 102 | 29 | 0 | 17 | 64 | 82 | 33 | 48 | 0 | .366 | .428 | .652 | 1.080 | .286 | 15.0% | 10.3% | .386 |
| 2017 | AAA | Scranton/Wilkes-Barre RailRiders | 26 | 2 | 7 | 0 | 0 | 0 | 0 | 0 | 0 | 0 | 1 | 0 | .000 | .000 | .000 | .000 | .000 | 14.3% | 0.0% | .000 |
| 2017 | AAA | — | 26 | 77 | 327 | 102 | 29 | 0 | 17 | 64 | 82 | 33 | 49 | 0 | .357 | .419 | .636 | 1.055 | .279 | 15.0% | 10.1% | .376 |
| 2018 | A+ | Jupiter Hammerheads | 27 | 7 | 20 | 3 | 0 | 0 | 0 | 0 | 0 | 2 | 2 | 0 | .167 | .250 | .167 | .417 | .000 | 10.0% | 10.0% | .188 |
| 2018 | AAA | New Orleans Baby Cakes | 27 | 9 | 34 | 9 | 1 | 0 | 1 | 2 | 5 | 3 | 5 | 0 | .300 | .382 | .433 | .815 | .133 | 14.7% | 8.8% | .333 |
| 2019 | A+ | Jupiter Hammerheads | 28 | 5 | 16 | 7 | 2 | 0 | 1 | 1 | 1 | 3 | 0 | 0 | .538 | .625 | .923 | 1.548 | .385 | 0.0% | 18.8% | .500 |
| 2021 | AAA | Jacksonville Jumbo Shrimp | 30 | 2 | 6 | 2 | 0 | 0 | 0 | 1 | 0 | 1 | 1 | 0 | .400 | .500 | .400 | .900 | .000 | 16.7% | 16.7% | .500 |
| 2022 | A | Jupiter Hammerheads | 31 | 3 | 11 | 3 | 0 | 0 | 0 | 2 | 1 | 3 | 1 | 0 | .375 | .545 | .375 | .920 | .000 | 9.1% | 27.3% | .429 |
| 2023 | AAA | Jacksonville Jumbo Shrimp | 32 | 1 | 4 | 0 | 0 | 0 | 0 | 0 | 0 | 0 | 1 | 0 | .000 | .000 | .000 | .000 | .000 | 25.0% | 0.0% | .000 |
| 2024 | AAA | Norfolk Tides | 33 | 20 | 84 | 22 | 3 | 0 | 4 | 9 | 24 | 9 | 20 | 0 | .310 | .393 | .521 | .914 | .211 | 23.8% | 10.7% | .367 |
| 2025 | AAA | Gwinnett Stripers | 34 | 35 | 138 | 28 | 4 | 0 | 2 | 8 | 17 | 13 | 33 | 1 | .228 | .312 | .309 | .621 | .081 | 23.9% | 9.4% | .295 |
OPS by game
No 2026 game log on record, so there is no chart.
Major leagues
Hitting
| Year | Club | Age | Games played. | Plate appearances: every trip to the plate, walks and hit-by-pitches included. | Hits. | Doubles. | Triples. | Home runs. | Runs scored. | Runs batted in. | Walks. | Strikeouts. | Stolen bases. | Batting average: hits divided by at-bats. | On-base percentage: how often he reaches base by a hit, walk or hit-by-pitch. | Slugging percentage: total bases divided by at-bats. | On-base plus slugging: OBP and SLG added together. | Isolated power: SLG minus AVG. It counts only the extra bases. | Strikeout rate: strikeouts divided by plate appearances. | Walk rate: walks divided by plate appearances. | Batting average on balls in play: hits other than home runs, divided by at-bats that ended with the ball in play. |
|---|---|---|---|---|---|---|---|---|---|---|---|---|---|---|---|---|---|---|---|---|---|
| 2017 | New York Yankees | 26 | 13 | 45 | 14 | 5 | 1 | 0 | 3 | 6 | 1 | 12 | 0 | .326 | .333 | .488 | .821 | .162 | 26.7% | 2.2% | .438 |
| 2018 | Miami Marlins | 27 | 14 | 38 | 7 | 1 | 0 | 0 | 2 | 2 | 4 | 12 | 0 | .212 | .316 | .242 | .558 | .030 | 31.6% | 10.5% | .333 |
| 2019 | Miami Marlins | 28 | 107 | 421 | 107 | 16 | 1 | 15 | 52 | 50 | 33 | 110 | 0 | .281 | .344 | .446 | .790 | .165 | 26.1% | 7.8% | .357 |
| 2020 | Miami Marlins | 29 | 34 | 133 | 34 | 8 | 0 | 6 | 20 | 20 | 11 | 31 | 0 | .283 | .353 | .500 | .853 | .217 | 23.3% | 8.3% | .337 |
| 2021 | Miami Marlins | 30 | 71 | 250 | 61 | 10 | 1 | 9 | 30 | 33 | 30 | 68 | 1 | .284 | .380 | .465 | .845 | .181 | 27.2% | 12.0% | .374 |
| 2022 | Miami Marlins | 31 | 119 | 469 | 108 | 33 | 2 | 9 | 37 | 50 | 40 | 119 | 0 | .261 | .337 | .415 | .752 | .154 | 25.4% | 8.5% | .340 |
| 2023 | Miami Marlins | 32 | 82 | 324 | 78 | 11 | 1 | 13 | 28 | 46 | 17 | 97 | 0 | .256 | .296 | .426 | .722 | .170 | 29.9% | 5.2% | .332 |
| 2023 | San Diego Padres | 32 | 41 | 133 | 28 | 7 | 0 | 4 | 14 | 15 | 14 | 35 | 0 | .239 | .323 | .402 | .725 | .163 | 26.3% | 10.5% | .304 |
| 2023 | 2 teams | 32 | 123 | 457 | 106 | 18 | 1 | 17 | 42 | 61 | 31 | 132 | 0 | .251 | .304 | .419 | .723 | .168 | 28.9% | 6.8% | .324 |
| 2024 | Chicago Cubs | 33 | 12 | 41 | 10 | 1 | 1 | 1 | 3 | 6 | 4 | 13 | 0 | .270 | .341 | .432 | .773 | .162 | 31.7% | 9.8% | .391 |
| 2024 | Boston Red Sox | 33 | 24 | 75 | 12 | 4 | 0 | 0 | 3 | 5 | 3 | 22 | 0 | .171 | .227 | .229 | .456 | .058 | 29.3% | 4.0% | .250 |
| 2024 | 2 teams | 33 | 36 | 116 | 22 | 5 | 1 | 1 | 6 | 11 | 7 | 35 | 0 | .206 | .267 | .299 | .566 | .093 | 30.2% | 6.0% | .296 |
Posts about him
None yet.
Stats from the MLB Stats API, through Oct 9, 2026.