
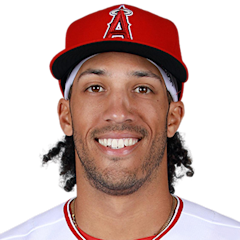
Dillon Thomas
LF · Last on a Brewers farm club: Biloxi Shuckers, 2019
- B/T
- L/L
- Size
- 6' 1", 215 lb
- Born
- 1992-12-10 · Houston, TX, USA
- Acquired
- Drafted 2011, round 4, pick 138, by Colorado Rockies
- MLB debut
- 2021-06-09
The path and tables below cover his minor-league seasons with any club, as the MLB Stats API lists them, through 2026. His major-league seasons are in the "Major leagues" section.
Level path
- ROK2011Casper Ghosts
- SS-A2012Tri-City Dust Devils
- A2013Asheville Tourists
- SS-A2014Tri-City Dust Devils
- A2014Asheville Tourists
- A+2015Modesto Nuts
- AA2016Hartford Yard Goats
- A+2017Lancaster JetHawks
- AA2017Hartford Yard Goats
- AAA2017Albuquerque Isotopes
- A+2018Carolina Mudcats
- AA2019Biloxi Shuckers
- AAA2021Tacoma Rainiers
- AAA2022Sugar Land Space Cowboys
- AAA2022Salt Lake Bees
- AAA2022
Hitting
| Year | Lvl | Club | Age | Games played. | Plate appearances: every trip to the plate, walks and hit-by-pitches included. | Hits. | Doubles. | Triples. | Home runs. | Runs scored. | Runs batted in. | Walks. | Strikeouts. | Stolen bases. | Batting average: hits divided by at-bats. | On-base percentage: how often he reaches base by a hit, walk or hit-by-pitch. | Slugging percentage: total bases divided by at-bats. | On-base plus slugging: OBP and SLG added together. | Isolated power: SLG minus AVG. It counts only the extra bases. | Strikeout rate: strikeouts divided by plate appearances. | Walk rate: walks divided by plate appearances. | Batting average on balls in play: hits other than home runs, divided by at-bats that ended with the ball in play. |
|---|---|---|---|---|---|---|---|---|---|---|---|---|---|---|---|---|---|---|---|---|---|---|
| 2011 | ROK | Casper Ghosts | 18 | 15 | 61 | 19 | 2 | 0 | 1 | 12 | 7 | 3 | 18 | 2 | .328 | .361 | .414 | .775 | .086 | 29.5% | 4.9% | .462 |
| 2012 | SS-A | Tri-City Dust Devils | 19 | 24 | 101 | 18 | 3 | 0 | 0 | 11 | 4 | 14 | 26 | 6 | .214 | .347 | .250 | .597 | .036 | 25.7% | 13.9% | .310 |
| 2013 | A | Asheville Tourists | 20 | 90 | 358 | 84 | 14 | 3 | 3 | 31 | 36 | 26 | 84 | 10 | .255 | .309 | .342 | .651 | .087 | 23.5% | 7.3% | .333 |
| 2014 | SS-A | Tri-City Dust Devils | 21 | 18 | 70 | 14 | 4 | 0 | 2 | 8 | 9 | 3 | 22 | 2 | .209 | .243 | .358 | .601 | .149 | 31.4% | 4.3% | .279 |
| 2014 | A | Asheville Tourists | 21 | 32 | 134 | 40 | 10 | 1 | 1 | 15 | 10 | 5 | 38 | 8 | .317 | .358 | .437 | .795 | .120 | 28.4% | 3.7% | .448 |
| 2015 | A+ | Modesto Nuts | 22 | 113 | 437 | 99 | 21 | 7 | 6 | 44 | 49 | 22 | 143 | 17 | .248 | .294 | .381 | .675 | .133 | 32.7% | 5.0% | .369 |
| 2016 | AA | Hartford Yard Goats | 23 | 111 | 419 | 108 | 37 | 1 | 4 | 39 | 46 | 28 | 97 | 13 | .289 | .353 | .425 | .778 | .136 | 23.2% | 6.7% | .375 |
| 2017 | A+ | Lancaster JetHawks | 24 | 12 | 53 | 12 | 1 | 0 | 1 | 7 | 3 | 2 | 18 | 6 | .240 | .283 | .320 | .603 | .080 | 34.0% | 3.8% | .355 |
| 2017 | AA | Hartford Yard Goats | 24 | 83 | 302 | 62 | 14 | 1 | 6 | 33 | 37 | 23 | 101 | 9 | .229 | .301 | .354 | .655 | .125 | 33.4% | 7.6% | .337 |
| 2017 | AAA | Albuquerque Isotopes | 24 | 3 | 3 | 0 | 0 | 0 | 0 | 0 | 1 | 0 | 0 | 0 | .000 | .000 | .000 | .000 | .000 | 0.0% | 0.0% | .000 |
| 2018 | A+ | Carolina Mudcats | 25 | 13 | 56 | 12 | 2 | 0 | 0 | 7 | 5 | 11 | 17 | 1 | .293 | .464 | .341 | .805 | .048 | 30.4% | 19.6% | .480 |
| 2019 | AA | Biloxi Shuckers | 26 | 131 | 504 | 119 | 25 | 6 | 13 | 62 | 71 | 41 | 132 | 22 | .265 | .339 | .434 | .773 | .169 | 26.2% | 8.1% | .345 |
| 2021 | AAA | Tacoma Rainiers | 28 | 94 | 395 | 90 | 19 | 1 | 13 | 68 | 47 | 41 | 117 | 12 | .269 | .377 | .448 | .825 | .179 | 29.6% | 10.4% | .374 |
| 2022 | AAA | Sugar Land Space Cowboys | 29 | 5 | 17 | 4 | 1 | 0 | 1 | 3 | 1 | 1 | 4 | 0 | .267 | .353 | .533 | .886 | .266 | 23.5% | 5.9% | .300 |
| 2022 | AAA | Salt Lake Bees | 29 | 108 | 475 | 108 | 22 | 2 | 17 | 72 | 77 | 55 | 123 | 6 | .271 | .379 | .464 | .843 | .193 | 25.9% | 11.6% | .346 |
| 2022 | AAA | — | 29 | 113 | 492 | 112 | 23 | 2 | 18 | 75 | 78 | 56 | 127 | 6 | .271 | .378 | .466 | .844 | .195 | 25.8% | 11.4% | .344 |
OPS by game
No 2026 game log on record, so there is no chart.
Major leagues
Hitting
| Year | Club | Age | Games played. | Plate appearances: every trip to the plate, walks and hit-by-pitches included. | Hits. | Doubles. | Triples. | Home runs. | Runs scored. | Runs batted in. | Walks. | Strikeouts. | Stolen bases. | Batting average: hits divided by at-bats. | On-base percentage: how often he reaches base by a hit, walk or hit-by-pitch. | Slugging percentage: total bases divided by at-bats. | On-base plus slugging: OBP and SLG added together. | Isolated power: SLG minus AVG. It counts only the extra bases. | Strikeout rate: strikeouts divided by plate appearances. | Walk rate: walks divided by plate appearances. | Batting average on balls in play: hits other than home runs, divided by at-bats that ended with the ball in play. |
|---|---|---|---|---|---|---|---|---|---|---|---|---|---|---|---|---|---|---|---|---|---|
| 2021 | Seattle Mariners | 28 | 4 | 9 | 1 | 0 | 0 | 0 | 2 | 2 | 0 | 7 | 0 | .111 | .111 | .111 | .222 | .000 | 77.8% | 0.0% | .500 |
| 2022 | Los Angeles Angels | 29 | 8 | 14 | 1 | 0 | 0 | 0 | 1 | 0 | 2 | 6 | 0 | .091 | .286 | .091 | .377 | .000 | 42.9% | 14.3% | .200 |
Posts about him
None yet.
Stats from the MLB Stats API, through Oct 9, 2026.