
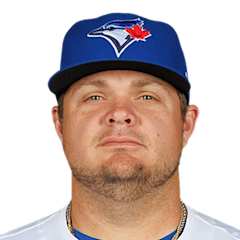
Daniel Vogelbach
1B · Last on a Brewers farm club: Nashville Sounds, 2021
- B/T
- L/R
- Size
- 6' 0", 270 lb
- Born
- 1992-12-17 · Orlando, FL, USA
- Acquired
- Drafted 2011, round 2, pick 68, by Chicago Cubs
- MLB debut
- 2016-09-12
The path and tables below cover his minor-league seasons with any club, as the MLB Stats API lists them, through 2026. His major-league seasons are in the "Major leagues" section.
Level path
- ROK2011AZL Cubs
- ROK2012AZL Cubs
- SS-A2012Boise Hawks
- A2013Kane County Cougars
- A+2013Daytona Cubs
- A+2014Daytona Cubs
- ROK2015AZL Cubs
- AA2015Tennessee Smokies
- AAA2016Iowa Cubs
- AAA2016Tacoma Rainiers
- AAA2016
- AAA2017Tacoma Rainiers
- AAA2018Tacoma Rainiers
- AAA2021Nashville Sounds
Hitting
| Year | Lvl | Club | Age | Games played. | Plate appearances: every trip to the plate, walks and hit-by-pitches included. | Hits. | Doubles. | Triples. | Home runs. | Runs scored. | Runs batted in. | Walks. | Strikeouts. | Stolen bases. | Batting average: hits divided by at-bats. | On-base percentage: how often he reaches base by a hit, walk or hit-by-pitch. | Slugging percentage: total bases divided by at-bats. | On-base plus slugging: OBP and SLG added together. | Isolated power: SLG minus AVG. It counts only the extra bases. | Strikeout rate: strikeouts divided by plate appearances. | Walk rate: walks divided by plate appearances. | Batting average on balls in play: hits other than home runs, divided by at-bats that ended with the ball in play. |
|---|---|---|---|---|---|---|---|---|---|---|---|---|---|---|---|---|---|---|---|---|---|---|
| 2011 | ROK | AZL Cubs | 18 | 6 | 27 | 7 | 3 | 0 | 1 | 4 | 6 | 2 | 2 | 1 | .292 | .370 | .542 | .912 | .250 | 7.4% | 7.4% | .286 |
| 2012 | ROK | AZL Cubs | 19 | 24 | 115 | 33 | 12 | 2 | 7 | 16 | 31 | 12 | 14 | 1 | .324 | .391 | .686 | 1.077 | .362 | 12.2% | 10.4% | .317 |
| 2012 | SS-A | Boise Hawks | 19 | 37 | 168 | 46 | 9 | 1 | 10 | 23 | 31 | 23 | 34 | 0 | .322 | .423 | .608 | 1.031 | .286 | 20.2% | 13.7% | .364 |
| 2013 | A | Kane County Cougars | 20 | 114 | 502 | 123 | 21 | 0 | 17 | 55 | 71 | 57 | 77 | 4 | .284 | .364 | .450 | .814 | .166 | 15.3% | 11.4% | .305 |
| 2013 | A+ | Daytona Cubs | 20 | 17 | 66 | 14 | 2 | 0 | 2 | 13 | 5 | 16 | 13 | 1 | .280 | .455 | .440 | .895 | .160 | 19.7% | 24.2% | .343 |
| 2014 | A+ | Daytona Cubs | 21 | 132 | 560 | 129 | 28 | 1 | 16 | 71 | 76 | 66 | 91 | 4 | .268 | .357 | .429 | .786 | .161 | 16.3% | 11.8% | .296 |
| 2015 | ROK | AZL Cubs | 22 | 5 | 17 | 5 | 2 | 0 | 0 | 4 | 0 | 6 | 1 | 0 | .455 | .647 | .636 | 1.283 | .181 | 5.9% | 35.3% | .500 |
| 2015 | AA | Tennessee Smokies | 22 | 76 | 313 | 69 | 16 | 1 | 7 | 41 | 39 | 57 | 61 | 1 | .272 | .403 | .425 | .828 | .153 | 19.5% | 18.2% | .330 |
| 2016 | AAA | Iowa Cubs | 23 | 89 | 365 | 97 | 18 | 2 | 16 | 53 | 64 | 55 | 67 | 0 | .318 | .425 | .548 | .973 | .230 | 18.4% | 15.1% | .362 |
| 2016 | AAA | Tacoma Rainiers | 23 | 44 | 198 | 37 | 7 | 0 | 7 | 26 | 32 | 42 | 34 | 0 | .240 | .404 | .422 | .826 | .182 | 17.2% | 21.2% | .263 |
| 2016 | AAA | — | 23 | 133 | 563 | 134 | 25 | 2 | 23 | 79 | 96 | 97 | 101 | 0 | .292 | .417 | .505 | .922 | .213 | 17.9% | 17.2% | .328 |
| 2017 | AAA | Tacoma Rainiers | 24 | 125 | 541 | 133 | 25 | 0 | 17 | 65 | 83 | 76 | 98 | 3 | .290 | .388 | .455 | .843 | .165 | 18.1% | 14.0% | .332 |
| 2018 | AAA | Tacoma Rainiers | 25 | 84 | 378 | 86 | 16 | 0 | 20 | 54 | 60 | 77 | 59 | 0 | .290 | .434 | .545 | .979 | .255 | 15.6% | 20.4% | .299 |
| 2021 | AAA | Nashville Sounds | 28 | 18 | 65 | 15 | 0 | 0 | 3 | 8 | 8 | 16 | 13 | 0 | .313 | .477 | .500 | .977 | .187 | 20.0% | 24.6% | .364 |
OPS by game
No 2026 game log on record, so there is no chart.
Major leagues
Hitting
| Year | Club | Age | Games played. | Plate appearances: every trip to the plate, walks and hit-by-pitches included. | Hits. | Doubles. | Triples. | Home runs. | Runs scored. | Runs batted in. | Walks. | Strikeouts. | Stolen bases. | Batting average: hits divided by at-bats. | On-base percentage: how often he reaches base by a hit, walk or hit-by-pitch. | Slugging percentage: total bases divided by at-bats. | On-base plus slugging: OBP and SLG added together. | Isolated power: SLG minus AVG. It counts only the extra bases. | Strikeout rate: strikeouts divided by plate appearances. | Walk rate: walks divided by plate appearances. | Batting average on balls in play: hits other than home runs, divided by at-bats that ended with the ball in play. |
|---|---|---|---|---|---|---|---|---|---|---|---|---|---|---|---|---|---|---|---|---|---|
| 2016 | Seattle Mariners | 23 | 8 | 13 | 1 | 0 | 0 | 0 | 0 | 0 | 1 | 6 | 0 | .083 | .154 | .083 | .237 | .000 | 46.2% | 7.7% | .167 |
| 2017 | Seattle Mariners | 24 | 16 | 31 | 6 | 1 | 0 | 0 | 0 | 2 | 3 | 9 | 0 | .214 | .290 | .250 | .540 | .036 | 29.0% | 9.7% | .316 |
| 2018 | Seattle Mariners | 25 | 37 | 102 | 18 | 2 | 0 | 4 | 9 | 13 | 13 | 26 | 0 | .207 | .324 | .368 | .692 | .161 | 25.5% | 12.7% | .246 |
| 2019 | Seattle Mariners | 26 | 144 | 558 | 96 | 17 | 0 | 30 | 73 | 76 | 92 | 149 | 0 | .208 | .341 | .439 | .780 | .231 | 26.7% | 16.5% | .232 |
| 2020 | Seattle Mariners | 27 | 18 | 64 | 5 | 1 | 0 | 2 | 3 | 4 | 11 | 13 | 0 | .094 | .250 | .226 | .476 | .132 | 20.3% | 17.2% | .079 |
| 2020 | Toronto Blue Jays | 27 | 2 | 5 | 0 | 0 | 0 | 0 | 0 | 0 | 1 | 2 | 0 | .000 | .200 | .000 | .200 | .000 | 40.0% | 20.0% | .000 |
| 2020 | Milwaukee Brewers | 27 | 19 | 67 | 19 | 2 | 0 | 4 | 13 | 12 | 8 | 18 | 0 | .328 | .418 | .569 | .987 | .241 | 26.9% | 11.9% | .417 |
| 2020 | 3 teams | 27 | 39 | 136 | 24 | 3 | 0 | 6 | 16 | 16 | 20 | 33 | 0 | .209 | .331 | .391 | .722 | .182 | 24.3% | 14.7% | .237 |
| 2021 | Milwaukee Brewers | 28 | 93 | 258 | 47 | 8 | 0 | 9 | 30 | 24 | 43 | 57 | 0 | .219 | .349 | .381 | .730 | .162 | 22.1% | 16.7% | .255 |
| 2022 | Pittsburgh Pirates | 29 | 75 | 278 | 54 | 10 | 1 | 12 | 29 | 34 | 40 | 67 | 0 | .228 | .338 | .430 | .768 | .202 | 24.1% | 14.4% | .264 |
| 2022 | New York Mets | 29 | 55 | 183 | 38 | 9 | 0 | 6 | 18 | 25 | 33 | 47 | 0 | .255 | .393 | .436 | .829 | .181 | 25.7% | 18.0% | .333 |
| 2022 | 2 teams | 29 | 130 | 461 | 92 | 19 | 1 | 18 | 47 | 59 | 73 | 114 | 0 | .238 | .360 | .433 | .793 | .195 | 24.7% | 15.8% | .290 |
| 2023 | New York Mets | 30 | 104 | 319 | 64 | 8 | 0 | 13 | 33 | 48 | 42 | 81 | 0 | .233 | .339 | .404 | .743 | .171 | 25.4% | 13.2% | .282 |
| 2024 | Toronto Blue Jays | 31 | 31 | 79 | 13 | 5 | 0 | 1 | 5 | 8 | 9 | 17 | 0 | .186 | .278 | .300 | .578 | .114 | 21.5% | 11.4% | .231 |
Posts about him
None yet.
Stats from the MLB Stats API, through Oct 9, 2026.