
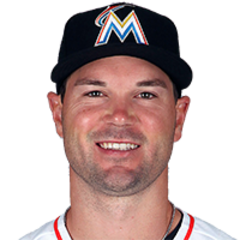
Cole Gillespie
LF · Last on a Brewers farm club: Nashville Sounds, 2009
- B/T
- R/R
- Size
- 6' 2", 215 lb
- Born
- 1984-06-20 · Portland, OR, USA
- Acquired
- Drafted 2006, round 3, pick 92, by Milwaukee Brewers
- MLB debut
- 2010-04-21
The path and tables below cover his minor-league seasons with any club, as the MLB Stats API lists them, through 2026. His major-league seasons are in the "Major leagues" section.
Level path
- ROK2006Helena Brewers
- A+2007Brevard County Manatees
- AA2008Huntsville Stars
- A+2009Brevard County Manatees
- AAA2009Nashville Sounds
- AAA2009Reno Aces
- AAA2009
- AAA2010Reno Aces
- AAA2011Reno Aces
- AAA2012Reno Aces
- AAA2013Fresno Grizzlies
- ROK2014GCL Blue Jays
- A+2014Dunedin Blue Jays
- AAA2014Tacoma Rainiers
- AAA2014Buffalo Bisons
- AAA2014
- AAA2015New Orleans Zephyrs
- AAA2016New Orleans Zephyrs
- AAA2017Pericos de Puebla
- AAA2017Acereros del Norte
- AAA2017
Hitting
| Year | Lvl | Club | Age | Games played. | Plate appearances: every trip to the plate, walks and hit-by-pitches included. | Hits. | Doubles. | Triples. | Home runs. | Runs scored. | Runs batted in. | Walks. | Strikeouts. | Stolen bases. | Batting average: hits divided by at-bats. | On-base percentage: how often he reaches base by a hit, walk or hit-by-pitch. | Slugging percentage: total bases divided by at-bats. | On-base plus slugging: OBP and SLG added together. | Isolated power: SLG minus AVG. It counts only the extra bases. | Strikeout rate: strikeouts divided by plate appearances. | Walk rate: walks divided by plate appearances. | Batting average on balls in play: hits other than home runs, divided by at-bats that ended with the ball in play. |
|---|---|---|---|---|---|---|---|---|---|---|---|---|---|---|---|---|---|---|---|---|---|---|
| 2006 | ROK | Helena Brewers | 22 | 51 | 233 | 64 | 12 | 1 | 8 | 49 | 31 | 40 | 34 | 18 | .344 | .464 | .548 | 1.012 | .204 | 14.6% | 17.2% | .381 |
| 2007 | A+ | Brevard County Manatees | 23 | 129 | 522 | 117 | 25 | 3 | 12 | 75 | 62 | 72 | 95 | 16 | .267 | .378 | .420 | .798 | .153 | 18.2% | 13.8% | .314 |
| 2008 | AA | Huntsville Stars | 24 | 131 | 550 | 130 | 38 | 4 | 14 | 73 | 79 | 75 | 102 | 17 | .281 | .386 | .472 | .858 | .191 | 18.5% | 13.6% | .331 |
| 2009 | A+ | Brevard County Manatees | 25 | 12 | 51 | 15 | 2 | 3 | 1 | 10 | 9 | 7 | 11 | 4 | .349 | .431 | .605 | 1.036 | .256 | 21.6% | 13.7% | .438 |
| 2009 | AAA | Nashville Sounds | 25 | 75 | 277 | 57 | 12 | 5 | 7 | 29 | 27 | 31 | 56 | 6 | .242 | .332 | .424 | .756 | .182 | 20.2% | 11.2% | .282 |
| 2009 | AAA | Reno Aces | 25 | 42 | 170 | 42 | 6 | 4 | 5 | 33 | 27 | 27 | 31 | 8 | .304 | .418 | .514 | .932 | .210 | 18.2% | 15.9% | .352 |
| 2009 | AAA | — | 25 | 117 | 447 | 99 | 18 | 9 | 12 | 62 | 54 | 58 | 87 | 14 | .265 | .365 | .457 | .822 | .192 | 19.5% | 13.0% | .309 |
| 2010 | AAA | Reno Aces | 26 | 69 | 312 | 76 | 14 | 6 | 8 | 54 | 49 | 44 | 49 | 8 | .288 | .394 | .477 | .871 | .189 | 15.7% | 14.1% | .327 |
| 2011 | AAA | Reno Aces | 27 | 137 | 583 | 145 | 19 | 16 | 12 | 100 | 79 | 81 | 91 | 24 | .300 | .405 | .479 | .884 | .179 | 15.6% | 13.9% | .343 |
| 2012 | AAA | Reno Aces | 28 | 126 | 510 | 136 | 35 | 4 | 13 | 85 | 66 | 59 | 80 | 11 | .308 | .390 | .494 | .884 | .186 | 15.7% | 11.6% | .347 |
| 2013 | AAA | Fresno Grizzlies | 29 | 74 | 269 | 65 | 11 | 2 | 9 | 35 | 31 | 32 | 52 | 7 | .277 | .361 | .455 | .816 | .178 | 19.3% | 11.9% | .318 |
| 2014 | ROK | GCL Blue Jays | 30 | 2 | 7 | 2 | 0 | 0 | 0 | 0 | 0 | 1 | 1 | 0 | .333 | .429 | .333 | .762 | .000 | 14.3% | 14.3% | .400 |
| 2014 | A+ | Dunedin Blue Jays | 30 | 2 | 9 | 3 | 1 | 0 | 0 | 1 | 3 | 1 | 2 | 0 | .375 | .444 | .500 | .944 | .125 | 22.2% | 11.1% | .500 |
| 2014 | AAA | Tacoma Rainiers | 30 | 16 | 68 | 21 | 5 | 1 | 5 | 14 | 14 | 9 | 9 | 2 | .362 | .456 | .741 | 1.197 | .379 | 13.2% | 13.2% | .364 |
| 2014 | AAA | Buffalo Bisons | 30 | 26 | 104 | 29 | 4 | 1 | 2 | 15 | 16 | 14 | 14 | 3 | .354 | .423 | .500 | .923 | .146 | 13.5% | 13.5% | .370 |
| 2014 | AAA | — | 30 | 42 | 172 | 50 | 9 | 2 | 7 | 29 | 30 | 23 | 23 | 5 | .357 | .436 | .600 | 1.036 | .243 | 13.4% | 13.4% | .368 |
| 2015 | AAA | New Orleans Zephyrs | 31 | 67 | 281 | 72 | 15 | 1 | 0 | 30 | 23 | 27 | 31 | 7 | .291 | .356 | .360 | .716 | .069 | 11.0% | 9.6% | .324 |
| 2016 | AAA | New Orleans Zephyrs | 32 | 37 | 136 | 23 | 5 | 0 | 1 | 7 | 11 | 14 | 23 | 1 | .190 | .279 | .256 | .535 | .066 | 16.9% | 10.3% | .227 |
| 2017 | AAA | Pericos de Puebla | 33 | 41 | 186 | 48 | 11 | 0 | 2 | 32 | 26 | 19 | 34 | 4 | .296 | .368 | .401 | .769 | .105 | 18.3% | 10.2% | .357 |
| 2017 | AAA | Acereros del Norte | 33 | 10 | 39 | 8 | 3 | 0 | 0 | 6 | 3 | 3 | 7 | 1 | .222 | .282 | .306 | .588 | .084 | 17.9% | 7.7% | .276 |
| 2017 | AAA | — | 33 | 51 | 225 | 56 | 14 | 0 | 2 | 38 | 29 | 22 | 41 | 5 | .283 | .353 | .384 | .737 | .101 | 18.2% | 9.8% | .342 |
OPS by game
No 2026 game log on record, so there is no chart.
Major leagues
Hitting
| Year | Club | Age | Games played. | Plate appearances: every trip to the plate, walks and hit-by-pitches included. | Hits. | Doubles. | Triples. | Home runs. | Runs scored. | Runs batted in. | Walks. | Strikeouts. | Stolen bases. | Batting average: hits divided by at-bats. | On-base percentage: how often he reaches base by a hit, walk or hit-by-pitch. | Slugging percentage: total bases divided by at-bats. | On-base plus slugging: OBP and SLG added together. | Isolated power: SLG minus AVG. It counts only the extra bases. | Strikeout rate: strikeouts divided by plate appearances. | Walk rate: walks divided by plate appearances. | Batting average on balls in play: hits other than home runs, divided by at-bats that ended with the ball in play. |
|---|---|---|---|---|---|---|---|---|---|---|---|---|---|---|---|---|---|---|---|---|---|
| 2010 | Arizona Diamondbacks | 26 | 45 | 113 | 24 | 8 | 0 | 2 | 11 | 12 | 7 | 29 | 1 | .231 | .283 | .365 | .648 | .134 | 25.7% | 6.2% | .297 |
| 2011 | Arizona Diamondbacks | 27 | 5 | 7 | 2 | 0 | 0 | 1 | 2 | 4 | 1 | 1 | 0 | .333 | .429 | .833 | 1.262 | .500 | 14.3% | 14.3% | .250 |
| 2013 | San Francisco Giants | 29 | 3 | 10 | 0 | 0 | 0 | 0 | 0 | 0 | 1 | 0 | 0 | .000 | .100 | .000 | .100 | .000 | 0.0% | 10.0% | .000 |
| 2013 | Chicago Cubs | 29 | 25 | 59 | 12 | 2 | 0 | 0 | 6 | 4 | 6 | 13 | 0 | .240 | .328 | .280 | .608 | .040 | 22.0% | 10.2% | .316 |
| 2013 | 2 teams | 29 | 28 | 69 | 12 | 2 | 0 | 0 | 6 | 4 | 7 | 13 | 0 | .203 | .294 | .237 | .531 | .034 | 18.8% | 10.1% | .255 |
| 2014 | Seattle Mariners | 30 | 34 | 78 | 18 | 2 | 0 | 1 | 9 | 5 | 6 | 13 | 2 | .254 | .312 | .324 | .636 | .070 | 16.7% | 7.7% | .298 |
| 2014 | Toronto Blue Jays | 30 | 1 | 3 | 0 | 0 | 0 | 0 | 0 | 0 | 0 | 0 | 0 | .000 | .000 | .000 | .000 | .000 | 0.0% | 0.0% | .000 |
| 2014 | 2 teams | 30 | 35 | 81 | 18 | 2 | 0 | 1 | 9 | 5 | 6 | 13 | 2 | .243 | .300 | .311 | .611 | .068 | 16.0% | 7.4% | .283 |
| 2015 | Miami Marlins | 31 | 67 | 157 | 42 | 10 | 2 | 2 | 17 | 16 | 10 | 27 | 4 | .290 | .333 | .428 | .761 | .138 | 17.2% | 6.4% | .342 |
| 2016 | Miami Marlins | 32 | 41 | 55 | 12 | 3 | 2 | 0 | 7 | 5 | 3 | 14 | 0 | .235 | .273 | .373 | .646 | .138 | 25.5% | 5.5% | .316 |
Posts about him
None yet.
Stats from the MLB Stats API, through Oct 9, 2026.