
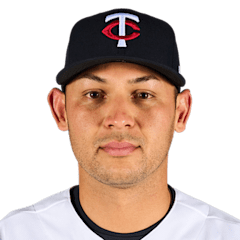
Alex Jackson
C · Last on a Brewers farm club: Nashville Sounds, 2023
- B/T
- R/R
- Size
- 6' 1", 238 lb
- Born
- 1995-12-25 · San Diego, CA, USA
- Acquired
- Drafted 2014, round 1, pick 6, by Seattle Mariners
- MLB debut
- 2019-04-07
The path and tables below cover his minor-league seasons with any club, as the MLB Stats API lists them, through 2026. His major-league seasons are in the "Major leagues" section.
Level path
- ROK2014AZL Mariners
- SS-A2015Everett AquaSox
- A2015Clinton LumberKings
- A2016Clinton LumberKings
- A+2017Florida Fire Frogs
- AA2017Mississippi Braves
- AA2018Mississippi Braves
- AAA2018Gwinnett Stripers
- AAA2019Gwinnett Stripers
- AAA2021Gwinnett Stripers
- ROK2022ACL Brewers Blue
- AAA2022Jacksonville Jumbo Shrimp
- AAA2022Nashville Sounds
- AAA2022
- AAA2023Nashville Sounds
- AAA2023Durham Bulls
- AAA2023
- AAA2024Durham Bulls
- AAA2025Scranton/Wilkes-Barre RailRiders
- AAA2026St. Paul Saints
Hitting
| Year | Lvl | Club | Age | Games played. | Plate appearances: every trip to the plate, walks and hit-by-pitches included. | Hits. | Doubles. | Triples. | Home runs. | Runs scored. | Runs batted in. | Walks. | Strikeouts. | Stolen bases. | Batting average: hits divided by at-bats. | On-base percentage: how often he reaches base by a hit, walk or hit-by-pitch. | Slugging percentage: total bases divided by at-bats. | On-base plus slugging: OBP and SLG added together. | Isolated power: SLG minus AVG. It counts only the extra bases. | Strikeout rate: strikeouts divided by plate appearances. | Walk rate: walks divided by plate appearances. | Batting average on balls in play: hits other than home runs, divided by at-bats that ended with the ball in play. |
|---|---|---|---|---|---|---|---|---|---|---|---|---|---|---|---|---|---|---|---|---|---|---|
| 2014 | ROK | AZL Mariners | 18 | 23 | 94 | 23 | 6 | 2 | 2 | 11 | 16 | 9 | 24 | 0 | .280 | .344 | .476 | .820 | .196 | 25.5% | 9.6% | .362 |
| 2015 | SS-A | Everett AquaSox | 19 | 48 | 197 | 39 | 11 | 1 | 8 | 31 | 25 | 21 | 61 | 2 | .239 | .365 | .466 | .831 | .227 | 31.0% | 10.7% | .326 |
| 2015 | A | Clinton LumberKings | 19 | 28 | 121 | 17 | 6 | 0 | 0 | 10 | 13 | 6 | 35 | 1 | .157 | .240 | .213 | .453 | .056 | 28.9% | 5.0% | .230 |
| 2016 | A | Clinton LumberKings | 20 | 92 | 381 | 81 | 20 | 1 | 11 | 43 | 55 | 34 | 103 | 2 | .243 | .332 | .408 | .740 | .165 | 27.0% | 8.9% | .317 |
| 2017 | A+ | Florida Fire Frogs | 21 | 66 | 282 | 70 | 17 | 0 | 14 | 44 | 45 | 13 | 74 | 0 | .272 | .333 | .502 | .835 | .230 | 26.2% | 4.6% | .329 |
| 2017 | AA | Mississippi Braves | 21 | 30 | 120 | 28 | 4 | 0 | 5 | 12 | 20 | 10 | 32 | 0 | .255 | .317 | .427 | .744 | .172 | 26.7% | 8.3% | .315 |
| 2018 | AA | Mississippi Braves | 22 | 64 | 252 | 45 | 12 | 1 | 5 | 27 | 24 | 20 | 78 | 0 | .200 | .282 | .329 | .611 | .129 | 31.0% | 7.9% | .280 |
| 2018 | AAA | Gwinnett Stripers | 22 | 35 | 125 | 22 | 11 | 2 | 3 | 15 | 17 | 12 | 42 | 0 | .204 | .296 | .426 | .722 | .222 | 33.6% | 9.6% | .292 |
| 2019 | AAA | Gwinnett Stripers | 23 | 85 | 345 | 70 | 9 | 0 | 28 | 52 | 65 | 20 | 118 | 1 | .229 | .313 | .533 | .846 | .304 | 34.2% | 5.8% | .261 |
| 2021 | AAA | Gwinnett Stripers | 25 | 30 | 123 | 31 | 9 | 1 | 11 | 21 | 36 | 11 | 35 | 1 | .287 | .366 | .694 | 1.060 | .407 | 28.5% | 8.9% | .317 |
| 2022 | ROK | ACL Brewers Blue | 26 | 1 | 2 | 1 | 1 | 0 | 0 | 1 | 0 | 1 | 0 | 0 | 1.000 | 1.000 | 2.000 | 3.000 | 1.000 | 0.0% | 50.0% | 1.000 |
| 2022 | AAA | Jacksonville Jumbo Shrimp | 26 | 1 | 4 | 0 | 0 | 0 | 0 | 0 | 0 | 0 | 1 | 0 | .000 | .000 | .000 | .000 | .000 | 25.0% | 0.0% | .000 |
| 2022 | AAA | Nashville Sounds | 26 | 31 | 119 | 23 | 8 | 1 | 2 | 9 | 18 | 12 | 28 | 1 | .225 | .319 | .382 | .701 | .157 | 23.5% | 10.1% | .284 |
| 2022 | AAA | — | 26 | 32 | 123 | 23 | 8 | 1 | 2 | 9 | 18 | 12 | 29 | 1 | .217 | .309 | .368 | .677 | .151 | 23.6% | 9.8% | .273 |
| 2023 | AAA | Nashville Sounds | 27 | 45 | 189 | 48 | 7 | 1 | 12 | 31 | 35 | 16 | 48 | 0 | .286 | .360 | .554 | .914 | .268 | 25.4% | 8.5% | .330 |
| 2023 | AAA | Durham Bulls | 27 | 14 | 59 | 16 | 4 | 0 | 4 | 11 | 10 | 2 | 14 | 0 | .281 | .305 | .561 | .866 | .280 | 23.7% | 3.4% | .308 |
| 2023 | AAA | — | 27 | 59 | 248 | 64 | 11 | 1 | 16 | 42 | 45 | 18 | 62 | 0 | .284 | .347 | .556 | .903 | .272 | 25.0% | 7.3% | .324 |
| 2024 | AAA | Durham Bulls | 28 | 28 | 118 | 25 | 5 | 1 | 8 | 17 | 20 | 12 | 27 | 0 | .238 | .322 | .533 | .855 | .295 | 22.9% | 10.2% | .243 |
| 2025 | AAA | Scranton/Wilkes-Barre RailRiders | 29 | 44 | 185 | 37 | 7 | 1 | 10 | 31 | 34 | 19 | 53 | 1 | .226 | .308 | .463 | .771 | .237 | 28.6% | 10.3% | .265 |
| 2026 | AAA | St. Paul Saints | 30 | 24 | 95 | 21 | 3 | 0 | 7 | 16 | 15 | 6 | 31 | 1 | .239 | .295 | .511 | .806 | .272 | 32.6% | 6.3% | .280 |
OPS by game
No 2026 game log on record, so there is no chart.
Major leagues
Hitting
| Year | Club | Age | Games played. | Plate appearances: every trip to the plate, walks and hit-by-pitches included. | Hits. | Doubles. | Triples. | Home runs. | Runs scored. | Runs batted in. | Walks. | Strikeouts. | Stolen bases. | Batting average: hits divided by at-bats. | On-base percentage: how often he reaches base by a hit, walk or hit-by-pitch. | Slugging percentage: total bases divided by at-bats. | On-base plus slugging: OBP and SLG added together. | Isolated power: SLG minus AVG. It counts only the extra bases. | Strikeout rate: strikeouts divided by plate appearances. | Walk rate: walks divided by plate appearances. | Batting average on balls in play: hits other than home runs, divided by at-bats that ended with the ball in play. |
|---|---|---|---|---|---|---|---|---|---|---|---|---|---|---|---|---|---|---|---|---|---|
| 2019 | Atlanta Braves | 23 | 4 | 15 | 0 | 0 | 0 | 0 | 0 | 0 | 1 | 5 | 0 | .000 | .133 | .000 | .133 | .000 | 33.3% | 6.7% | .000 |
| 2020 | Atlanta Braves | 24 | 5 | 7 | 2 | 1 | 0 | 0 | 0 | 0 | 0 | 4 | 0 | .286 | .286 | .429 | .715 | .143 | 57.1% | 0.0% | .667 |
| 2021 | Atlanta Braves | 25 | 10 | 28 | 1 | 0 | 0 | 0 | 2 | 0 | 2 | 13 | 0 | .043 | .214 | .043 | .257 | .000 | 46.4% | 7.1% | .100 |
| 2021 | Miami Marlins | 25 | 42 | 123 | 17 | 4 | 0 | 3 | 11 | 12 | 11 | 60 | 0 | .157 | .260 | .278 | .538 | .121 | 48.8% | 8.9% | .311 |
| 2021 | 2 teams | 25 | 52 | 151 | 18 | 4 | 0 | 3 | 13 | 12 | 13 | 73 | 0 | .137 | .252 | .237 | .489 | .100 | 48.3% | 8.6% | .273 |
| 2022 | Milwaukee Brewers | 26 | 5 | 12 | 3 | 0 | 0 | 0 | 0 | 0 | 0 | 7 | 0 | .250 | .250 | .250 | .500 | .000 | 58.3% | 0.0% | .600 |
| 2024 | Tampa Bay Rays | 28 | 58 | 155 | 17 | 7 | 0 | 3 | 17 | 12 | 12 | 53 | 1 | .122 | .201 | .237 | .438 | .115 | 34.2% | 7.7% | .167 |
| 2025 | Baltimore Orioles | 29 | 37 | 100 | 20 | 8 | 0 | 5 | 17 | 8 | 5 | 37 | 0 | .220 | .290 | .473 | .763 | .253 | 37.0% | 5.0% | .306 |
| 2026 | Minnesota Twins | 30 | 33 | 73 | 21 | 4 | 0 | 1 | 12 | 5 | 2 | 24 | 0 | .304 | .342 | .406 | .748 | .102 | 32.9% | 2.7% | .455 |
Pitching
| Year | Club | Age | Games pitched in. | Games started. | Wins. | Losses. | Saves. | Innings pitched. The digit after the point is outs: 110.1 is 110 innings and one out. | Hits allowed. | Walks allowed. | Strikeouts. | Home runs allowed. | Earned run average: earned runs allowed per nine innings. | Walks plus hits allowed per inning pitched. | Strikeouts per nine innings. | Walks per nine innings. | Strikeout rate: strikeouts divided by batters faced. | Walk rate: walks divided by batters faced. | Strikeout rate minus walk rate, both as a share of batters faced. |
|---|---|---|---|---|---|---|---|---|---|---|---|---|---|---|---|---|---|---|---|
| 2025 | Baltimore Orioles | 29 | 1 | 0 | 0 | 0 | 0 | 1.0 | 3 | 2 | 0 | 0 | 27.00 | 5.00 | 0.00 | 18.00 | 0.0% | 25.0% | -25.0% |
| 2026 | Minnesota Twins | 30 | 2 | 0 | 0 | 0 | 0 | 2.0 | 3 | 1 | 0 | 2 | 13.50 | 2.00 | 0.00 | 4.50 | 0.0% | 10.0% | -10.0% |
Posts about him
None yet.
Stats from the MLB Stats API, through Oct 9, 2026.